. 2014 Apr 22;2(4):e12002.
doi: 10.14814/phy2.12002. Print 2014.

Epithelial monolayer culture system for real-time single-cell analyses

Affiliations

Epithelial monolayer culture system for real-time single-cell analyses

Jong Bae Seo et al. Physiol Rep. .

Abstract

Abstract Many epithelial cells form polarized monolayers under in vivo and in vitro conditions. Typically, epithelial cells are cultured for differentiation on insert systems where cells are plated on a porous filter membrane. Although the cultured monolayers have been a standard system to study epithelial physiology, there are some limits: The epithelial cells growing inside the commercial inserts are not optimal to visualize directly through lenses on inverted microscopes. The cell images are optically distorted and background fluorescence is bright due to the filter membrane positioned between the cells and the lens. In addition, the cells are not easily accessible by electrodes due to the presence of tall side walls. Here, we present the design, fabrication, and practical applications of an improved system for analysis of polarized epithelial monolayers. This new system allows (1) direct imaging of cells without an interfering filter membrane, (2) electrophysiological measurements, and (3) detection of apical secretion with minimal dilution. Therefore, our culture method is optimized to study differentiated epithelial cells at the single-cell and subcellular levels, and can be extended to other cell types with minor modifications.

Keywords: Ca2+ signal; electrophysiology; epithelial culture; imaging; salt secretion.


Figures

Figure 1.
Figure 1.
Fabrication of disk membranes and culture method. (A) Disk membrane ‘sandwich’ construction. Disks comprised three layers: two thin O‐rings with a filter membrane in the middle. See Materials and Methods for detailed information. (B) Assembled and coated disk membranes in a standard 24‐well plate ready to be used for submerged cell culture. (C, D) Air–liquid interface culture of Calu‐3 cells. A schematic diagram for a disk membrane sitting on the top of a nylon snap‐in bushing (C) and disk membranes containing confluent Calu‐3 cells in a six‐well plate (D). First, each well is filled with 4.5‐mL culture medium and a bushing (black) is added. It is necessary to take care to exclude bubbles from under the disk membrane. The disk membrane assembly allows serosal retention of approximately 1 mL of culture medium through surface tension. A portion of medium (3.5 mL) is freshly exchanged two or three times per week. Two vents on the sides of the bushing promote free exchange of medium to the basolateral surface of Calu‐3 cells.
Figure 2.
Figure 2.
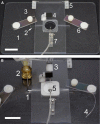
Experimental chamber for disk membranes. (A) Platform before assembly of the disk membrane. It consists of (1) stage adapter, (2) perfusion groove to accommodate inlet and outlet of lower perfusion adapter (not visible here, see Fig. 3B2), (3) magnetic tape (black) for installation of lower perfusion suction attachment (No. 2 in B), (4) adjustable perfusion manifold holder, (5) hinge to accommodate a cover to push down upper perfusion chamber, (6) tension clip for the cover (fixed to the platform by a Delrin pin on the right and a smaller plastic bolt to control push pressure on the left), and (7) adjustable suction system incorporating slit stainless steel tube. (B) Assembled perfusion system; (1) suction wick for the lower luminal chamber, (2) magnetized suction needle, (3) perfusion manifold, (4) lower perfusion inlet connector, (5) assembled unit including disk holder insert for upper perfusion, disk membrane, and lower perfusion insert (from top to bottom sequence, see Fig. 3B for its step‐by‐step assembly). Scale bar = 2 cm for both photographs.
Figure 3.
Figure 3.
Assembly of disk membrane and chambers. Sequential images for single (A)‐ and double (B)‐sided perfusion experiments. (A) Perfusion from the upper side of the monolayer. Step 1: Place a standard coverslip (#0 or #1) over the opening of stage adaptor. Load a drop of luminal or serosal solution (10–20 μL) at the center of the coverslip. Remove a disk membrane from culture and gently rinse in 5 mL of the luminal solution. Place the disk membrane on the white upper chamber with cells oriented either up or down as suits your experimental purpose. The disk membrane, due to surface tension of the buffer, will adhere to the upper chamber as shown. However, it may be helpful to use a Kimwipe or paper towel to wick away extra fluid from the disk membrane ring before placing on the upper chamber surface. Step 2: Place upper chamber and disk membrane on the stage adaptor. Step 3: Gently lower the upper part of the clamshell chamber (acrylic push cover) into position and secure the tension clip. Note that inlet and outlet needles are preadjusted and positioned to the same positions when the push cover is locked. Insert a round filter paper between suction needle and a notch for smooth suction of bath solution. (B) For double‐sided perfusion, a Sylgard lower chamber needs to be installed underneath the disk membrane. Step 1: Place a wick which will allow pressure‐free removal of the lower chamber perfusate. Step 2: Apply vacuum grease, sparingly to avoid squeeze‐out, to the underside of the lower chamber and gently press it on the coverslip so that the split in the lower chamber overlaps the wick, allowing for perfusate exit. Step 3: Open the valve to the lower chamber perfusate and allow the reservoir to be slightly over filled with the luminal or serosal solution. At this point the wick should not be in contact with the perfusate so that surface tension creates a small dome on the perfusate in the lower chamber. Place the disk membrane on the upper chamber. Step 4: Place the upper chamber/disk membrane onto the lower chamber, one side first, to avoid bubbles in the lower chamber. Step 5: Close the clamshell chamber. Step 6: After positioning the lower chamber suction (yellow needle) just beyond the end of the wick and securing the tension clips, begin perfusion with control solutions.
Figure 4.
Figure 4.
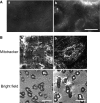
Comparison of fluorescence images with and without interfering plastic membrane. (A) Epifluorescence micrographs of PDEC monolayers. After labeling with 2 μmol/L FM 1‐43 (Cat. No. F‐35355, Invitrogen‐Life Technologies) for 6 h in culture medium, PDEC monolayers were illuminated and visualized through the supporting filter membrane of the insert (a) and directly without the filter membrane (b). Images were obtained with a 20× oil lens (Plan Fluor, NA 0.75, Nikon) and an inverted epifluorescence microscope (TE2000‐U, Nikon) equipped with Evolve 512 EMCCD (Photometrics). (B) Confocal micrographs of PDEC monolayers. PDEC monolayers were labeled with 50 nmol/L Mitotracker Red CMXRos (Cat. No. M‐7512, Invitrogen‐Life Technologies) for 15 min in culture medium at 37°C and then obtained with a 63× oil lens (Plan Apochromat, NA1.40) and Zeiss 710 laser‐scanning confocal microscope. Scale bar = 20 μm
Figure 5.
Figure 5.
Confocal fluorescence microscopy of epithelial monolayers. Polarized PDEC (A) and Calu‐3 (B) monolayers. Left micrographs are confocal differential interface contrast images with the luminal membrane facing down. Right micrographs are confocal images with z‐stack profiles for x‐ and y‐axes. The monolayers were stained with 8 μmol/L FM 1‐43 in the luminal buffer for 30 min. FM 1‐43 dye was excited at 510 nm and fluorescence emission was detected at 626 nm. Fluorescence images were improved by digital deconvolution using Image J software. Scale bar = 20 μm.
Figure 6.
Figure 6.
Measurement of transepithelial electrical resistance (TER) of PDEC and Calu‐3 monolayers after basolateral permeabilization with Amphotericin B (0.5 mg/mL). (A) Initial TER of PDEC and Calu‐3 monolayer. (B) TER of both monolayers was reduced by 10 μmol/L forskolin (n = 4 monolayers for each cell type).
Figure 7.
Figure 7.
Monitoring of SOC proteins in PDEC monolayers. (A, B) Confocal images of PDEC transfected with Orai1‐Orange and STIM1‐GFP. Control (A) and after depletion of Ca2+ stores with 5 μmol/L thapsigargin for 15 min in Ca2+‐free Ringer's solution (B). X–Z and Y–Z reconstructions were obtained across the nucleus voids to better separate the apical and basolateral membranes. A transfected cell surrounded by untransfected cells was chosen for both conditions. Scale bar = 20 μm. (C, D) Confocal Ca2+ imaging of PDEC monolayers loaded with Fluo‐4 Ca2+ dye to localize the functional SOC. Untransfected (C) and Orai1‐Orange and STIM1‐GFP‐transfected (D) monolayers were treated with thapsigargin for store depletion for SOC activation and then perfused with Ringer's without Ca2+ (with 1 mmol/L EGTA) and subsequently with Ringer's containing 2 mmol/L Ca2+.
Figure 8.
Figure 8.
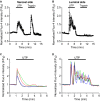
Measurement of intracellular Ca2+ signals of PDEC. Confocal Ca2+ measurements using Fluo‐4 dye for monolayers and single cells. Relative Fluo‐4 intensity was calibrated to the initial fluorescence levels of each cell. (A, B) Confocal Ca2+ imaging of PDEC monolayers upon activation of serosal and luminal purinergic and PAR‐2 receptors using 100 μmol/L UTP and 1 μmol/L trypsin, respectively (n = 3 monolayers and 6–7 single cells per monolayer). Ca2+ response of a single isolated cell (C) and neighboring single cells in a monolayer (D) upon 100 μmol/L UTP. For the monolayer experiment, UTP was applied to the luminal side. The same experiment is shown in Movie S2.
Figure 9.
Figure 9.
Measurement of luminal pH of Calu‐3 epithelial monolayers using BCECF‐dextran. (A) A schematic diagram of assembled chamber including cells mounted and oriented to form an ‘artificial duct’. Not drawn to scale. In this example, the system is configured only for serosal (basolateral) perfusion of the membrane with (1) suction, (2) perfusion inlet, (3) disk membrane holder insert (i.e., upper chamber), (4) porous membrane with attached cells, (5) white outer rim portion of disk membrane (the same component as 1 and 3 from Fig. 1A), (6) glass coverslip, and (7) microscope objective. Black dot indicates approximate focal plane for BCECF experiments. (B) pH of luminal buffer adjacent to the apical membrane of Calu‐3 cells. Initial perfusion of a serosal bicarbonate‐free buffer was followed by a serosal bicarbonate buffer gassed with 95% O2/5% CO2, and then followed by the addition of 10 μmol/L forskolin (n = 7 monolayers).
Figure 10.
Figure 10.
Microamperometry to detect exocytosis from differentiated PDEC. (A) Apical (luminal) exocytosis was triggered by luminal application of 100 μmol/L UTP and measured with a carbon fiber microelectrode. (B) Apical exocytosis was analyzed before and during UTP application (n = 6 monolayers). (C) Basolateral exocytosis was evoked by serosal application of 100 μmol/L UTP. Single amperometric events are shown with an expanded timescale on the right. (D) For basolateral access, a carbon fiber microelectrode was placed through the pores of the filter membrane. Scale bar = 20 μm.
Figure 11.
Figure 11.
Various applications of epithelial monolayer on disk membrane. Artificial ducts can be constructed in ‘inside‐in’ (A) or ‘inside‐out’ configuration (B) by stacking two disk membranes with a thin sealing grease layer between them (black). (C) A possible experiment using the artificial ducts. Paracrine secretion from the upper monolayer upon stimulation (black arrow) can diffuse through a narrow gap and activate the lower monolayer (green). If the secreted transmitter such as ATP activates intracellular signals such as Ca2+, the cells act as a cell sensor. (D) One can monitor intercellular signals such as Ca2+ propagating from a cell through the monolayer and Ca2+ synchronization between neighboring cells via gap junctions (e.g., Movie S2).

Similar articles

Cited by

References

    1. Acevedo M., Steele L. W. 1993. Na+‐H+ exchanger in isolated epithelial tracheal cells from sheep. Involvement in tracheal proton secretion. Exp. Physiol.; 78:383-394 - PubMed
    1. Al‐Bazzaz F. J., Hafez N., Tyagi S., Gailey C. A., Toofanfard M., Alrefai W. A. 2001. Detection of Cl–HCO3‐ and Na+‐H+ exchangers in human airways epithelium. JOP; 2:285-290 - PubMed
    1. Ambudkar I. S. 2012. Polarization of calcium signaling and fluid secretion in salivary gland cells. Curr. Med. Chem.; 19:5774-5781 - PMC - PubMed
    1. Bens M., Vandewalle A. 2008. Cell models for studying renal physiology. Pflugers Arch.; 457:1-15 - PubMed
    1. Bridges R. J. 2012. Mechanisms of bicarbonate secretion: lessons from the airways. Cold Spring Harb. Perspect. Med.; 2:a015016. - PMC - PubMed