. 2014 Jun 1;192(11):5109-17.
doi: 10.4049/jimmunol.1302254. Epub 2014 Apr 25.

An increase in tolerogenic dendritic cell and natural regulatory T cell numbers during experimental autoimmune encephalomyelitis in Rras-/- mice results in attenuated disease

Affiliations

An increase in tolerogenic dendritic cell and natural regulatory T cell numbers during experimental autoimmune encephalomyelitis in Rras-/- mice results in attenuated disease

Avijit Ray et al. J Immunol. .

Abstract

R-Ras is a member of the Ras superfamily of small GTPases, which are regulators of various cellular processes, including adhesion, survival, proliferation, trafficking, and cytokine production. R-Ras is expressed by immune cells and has been shown to modulate dendritic cell (DC) function in vitro and has been associated with liver autoimmunity. We used Rras-deficient mice to study the mechanism whereby R-Ras contributes to autoimmunity using experimental autoimmune encephalomyelitis (EAE), a mouse model of the CNS autoimmune disease multiple sclerosis. We found that a lack of R-Ras in peripheral immune cells resulted in attenuated EAE disease. Further investigation revealed that, during EAE, absence of R-Ras promoted the formation of MHC II(low) DC concomitant with a significant increase in proliferation of natural regulatory T cells, resulting in an increase in their cell numbers in the periphery. Our study suggests a novel role for R-Ras in promoting autoimmunity through negative regulation of natural regulatory T cell numbers by inhibiting the development of MHCII(low) DC with tolerogenic potential.


Figures

Figure 1
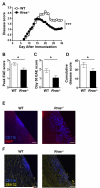
Figure 1. Rras−/− mice exhibit attenuated EAE disease severity
A-F, EAE was induced in WT or Rras−/− mice at 6-8 wk of age by s.c. immunization with MOG35-55 peptide. A, Clinical signs of EAE were evaluated daily starting on day seven and the data shown are the daily average of 15 WT and 15 Rras−/− mice. B, The mean ± SE peak disease score is shown for WT mice on day 20 and day 15 for Rras−/− mice. C, The mean ± SE disease score at the end of the experiment on day 30 is shown. D, The cumulative disease score was calculated by adding the daily scores of each mouse from day 7-30 and shown as the mean ± SE of all the mice in each group. E-F, longitudinal frozen sections from the spinal cord of mice 17 days after EAE induction were generated from WT and Rras−/− mice. The sections were stained with anti-CD11b (blue) (E,F), anti-MBP (red) (E) and with the SMI-32 antibody (yellow) (F) and analyzed by immunofluorescence. Overlaid images of CD11b and MBP (E) or SMI-32 (F) are shown. Data shown are representative of two mice in each group. *p<0.05, ***p<0.001. Scale bar: 80 μm.
Figure 2
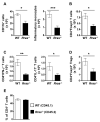
Figure 2. The absolute number of CD11b+ cells, CD4+ T cells and those producing IFN-γ or IL-17 are reduced in the CNS of Rras−/− mice during EAE
A-E, EAE was induced in WT and Rras−/− mice at 6-8 wk of age by immunization with MOG35-55 peptide. A-D, CNS mononuclear cells were isolated 17 days after EAE induction and the absolute number of total myeloid cells (CD11b+) (A), inflammatory monocytes (CD11b+Ly6C+CCR2+) (A), effector CD4 T cells (CD4+Foxp3) (B), IFN-γ and IL-17 producing CD4+ cells (C) and Treg (CD4+Foxp3+) (D) were determined by flow cytometry. Pooled data from three (A-C) or four (D) independent experiments with nine (A,B), 8-9 (C) or 12 (D) total mice in each group are shown. E, lethally irradiated WT mice were transplanted with an equal mix of CD45.1+ WT and CD45.2+ Rras−/− BM cells to generate mixed BM chimera mice. Ten weeks after BM reconstitution, EAE was induced by immunization with MOG35-55 peptide. At the peak of EAE disease, the percentages of WT (CD45.1+) and Rras−/− (CD45.2+) cells amongst CNS infiltrating effector T cells (CD4+Foxp3) was determined. Pooled data from 2 independent experiments with eight mice in each group are shown. *p<0.05, **p<0.01, ***p<0.001.
Figure 3
Figure 3. Rras-deficiency in the periphery, but not in the CNS, results in attenuated EAE severity
A,B, chimera mice in which either the CNS and peripheral radioresistant cells (WT→Rras−/−) or the peripheral immune cells (Rras−/−→WT) were deficient in R-Ras were generated by transplanting lethally irradiated Rras−/− (A) or WT (B) recipient mice with WT (A) or Rras−/− (B) BM cells. Control chimeras were generated by transplanting WT BM into WT mice (WT→WT) (A,B). Ten weeks after BM reconstitution, EAE was induced by immunization with MOG35-55 peptide and EAE disease was scored daily starting on day 7. Representative data of two independent experiments with five mice in each group (A) or data from one experiment with six mice in the WT→WT and four mice in the Rras−/−→WT group are shown (B). C, EAE was induced in WT or Rras−/− mice with MOG35-55 peptide and seven days later purified CD4+ cells from the draining BLN were stimulated in vitro with varying concentrations of MOG35-55 peptide and their proliferation was determined by CFSE dye dilution by flow cytometry. Dead cells were excluded using DAPI. Percentages of proliferating CD4+CD11bDAPI cells at different concentrations of MOG35-55 peptide are shown. Pooled data from three independent experiments with six mice in each group are shown. ***p<0.001.
Figure 4
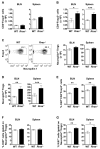
Figure 4. Increased numbers of MHCIIlo DC are present in the BLN and spleen of Rras−/− mice during EAE
A,B, EAE was induced as for Fig. 1 and the presence of MHCIIlo DC was evaluated 17 days later in WT and Rras−/− mice. A, The percentage of CD11c-gated MHCIIlo cells in the BLN (left panel) and spleen (middle panel) is shown. One representative experiment showing MHCII expression levels in the spleen is shown (right panel). B, The absolute number of CD11c-gated MHCIIlo cells in the BLN (left panel) and spleen (middle panel) is shown. Data shown are the mean ± SE of two independent experiments with six mice in each group. *p<0.05, **p<0.01.
Figure 5
Figure 5. Enhanced proliferation of leads to increased numbers of nTreg in the BLN and spleen of Rras−/− mice during EAE
A,B, The absolute number of CD4+Foxp3+ cells in the BLN (left panel) and spleen (right panel) of WT and Rras−/− mice when naïve (A) or 17 days after EAE induction (as for Fig. 1) (B) is shown. Data shown are the mean ± SE of pooled data from three to four independent experiments with 8-12 mice in each group. C,D, The percentage (C, left panel) and absolute number (C, right panel and D) of CD4+Foxp3+ cells expressing high levels of Neuropilin-1 (Neuropilinhi) was determined in the spleen (C, left and right panel and D) and the BLN (C, right panel and D) in WT and Rras−/− naïve mice (C) and 17 days after EAE induction (D). Data shown are the mean ± SE of pooled data from two to three independent experiments with 6-10 mice in each group. E,G) The proliferation of CD4+Foxp3+ (E) and CD4+Foxp3+ Neuropilinhi (F,G) cells was determined by Ki67 expression in WT and Rras−/− naïve mice (F) and 17 days after EAE induction (E,G). Data shown are the mean ± SE of pooled data from two independent experiments with 6-7 mice in each group. *p<0.05, **p<0.01, ***p<0.001.
Figure 6
Figure 6. Rras−/− MHCIIlo DC promote increased maintenance and proliferation of natural Tregs
A, Splenic Treg (CD4+EGFP+) were FACS purified and labeled with cell proliferation dye, and cocultured with FACS purified splenic CD11c+MHCIIlo or CD11c+MHCIIhi cells from WT or Rras−/− mice at day 17 after EAE induction in the presence of soluble anti-CD3. Four days post culture, proliferation of CD4+EGFP+ Treg was determined by flow cytometry and the percentage of cells that had undergone proliferation is shown. Representative data from two independent experiments are shown. B, C, Sorted and labeled splenic Treg (CD4+EGFP+) were i.v. transferred into WT or Rras−/− mice on day 11 after EAE induction. Seven days later, the absolute number (mean ± SE) (B) and proliferation (C) of the transferred EGFP+ Tregs in the spleen of the recipient mice was determined by flow cytometry. Pooled data (B) from two independent experiments with six mice in each group or representative (C (left panel)) and pooled (C (right panel)) data from one of two experiments with three mice in each group are shown. *p<0.05, **p<0.01.

Similar articles

Cited by

References

    1. Czyzyk J, Chen HC, Bottomly K, Flavell RA. p21 Ras/impedes mitogenic signal propagation regulates cytokine production and migration in CD4 T cells. J. Biol. Chem. 2008;283:23004–23015. - PMC - PubMed
    1. Johnson DS, Chen YH. Ras family of small GTPases in immunity and inflammation. Curr. Opin. Pharmacol. 2012;12:458–463. - PMC - PubMed
    1. Reedquist KA, Tak PP. Signal transduction pathways in chronic inflammatory autoimmune disease: small GTPases. Open Rheumatol. J. 2012;6:259–272. - PMC - PubMed
    1. Shang X, Cancelas JA, Li L, Guo F, Liu W, Johnson JF, Ficker A, Daria D, Geiger H, Ratner N, Zheng Y. R-Ras and Rac GTPase cross-talk regulates hematopoietic progenitor cell migration, homing, and mobilization. J. Biol. Chem. 2011;286:24068–24078. - PMC - PubMed
    1. Zhang Z, Vuori K, Wang H, Reed JC, Ruoslahti E. Integrin activation by R-ras. Cell. 1996;85:61–69. - PubMed

Publication types

MeSH terms