. 2014 Mar;22(3):522-547.
doi: 10.1080/13506285.2014.884203. Epub 2014 Mar 14.

Blur Detection is Unaffected by Cognitive Load

Affiliations
Free PMC article

Blur Detection is Unaffected by Cognitive Load

Lester C Loschky et al. Vis cogn. 2014 Mar.
Free PMC article

Abstract

Blur detection is affected by retinal eccentricity, but is it also affected by attentional resources? Research showing effects of selective attention on acuity and contrast sensitivity suggests that allocating attention should increase blur detection. However, research showing that blur affects selection of saccade targets suggests that blur detection may be pre-attentive. To investigate this question, we carried out experiments in which viewers detected blur in real-world scenes under varying levels of cognitive load manipulated by the N-back task. We used adaptive threshold estimation to measure blur detection thresholds at 0°, 3°, 6°, and 9° eccentricity. Participants carried out blur detection as a single task, a single task with to-be-ignored letters, or an N-back task with four levels of cognitive load (0, 1, 2, or 3-back). In Experiment 1, blur was presented gaze-contingently for occasional single eye fixations while participants viewed scenes in preparation for an easy picture recognition memory task, and the N-back stimuli were presented auditorily. The results for three participants showed a large effect of retinal eccentricity on blur thresholds, significant effects of N-back level on N-back performance, scene recognition memory, and gaze dispersion, but no effect of N-back level on blur thresholds. In Experiment 2, we replicated Experiment 1 but presented the images tachistoscopically for 200 ms (half with, half without blur), to determine whether gaze-contingent blur presentation in Experiment 1 had produced attentional capture by blur onset during a fixation, thus eliminating any effect of cognitive load on blur detection. The results with three new participants replicated those of Experiment 1, indicating that the use of gaze-contingent blur presentation could not explain the lack of effect of cognitive load on blur detection. Thus, apparently blur detection in real-world scene images is unaffected by attentional resources, as manipulated by the cognitive load produced by the N-back task.

Keywords: attention; blur detection; cognitive load; eye movements; retinal eccentricity.


Figures
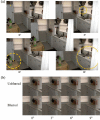
Figure 1.
Figure 1.
(a) Sample images that have been blurred at 0°, 3°, 6°, and 9° retinal eccentricity from an unblurred base image (centre). The dotted ring represents the edge of the window (absent in the 0° retinal eccentricity where the entire image is blurred), but was not seen by the participants. Note that the strength of the blur increases with increasing window edge retinal eccentricity (as represented by distance from the yellow dot to the dotted ring, neither seen by participants). This was done to equate blur detectability at each retinal eccentricity. (b) Several enlarged samples of the example image are shown to more easily perceive the blur strengths for each retinal eccentricity. To make the blur levels more perceptible for readers, we increased the example blur strength for each eccentricity by setting the low-pass filter cpd cut-off to 76% of the mean threshold cpd cut-off value found in Experiment 1. The blur is most easily perceived by comparing the unblurred and blurred fine detailed areas such as the window blinds (upper left) and the text on the upside-down bucket (lower right).
Figure 2.
Figure 2.
Experiment 1, N-back sensitivity (d’) as a function of N. Results shown for individual participants (1–3) and their overall mean. Error bars = 95% CI of the mean. (To view this figure in colour, please see the online version)
Figure 3.
Figure 3.
Experiment 1, scene recognition memory accuracy (% correct) as a function of cognitive load (N-back level, or control condition). Results shown for individual participants (1–3) and their overall mean. Error bars = 95% CI of the mean. (To view this figure in colour, please see the online version)
Figure 4.
Figure 4.
Experiment 1, fixation location dispersion (measured by the bivariate contour ellipse in pixels) as a function of cognitive load (N-back level, or control condition). Results shown for individual participants (1–3) and their overall mean. Error bars = 95% CI of the mean. (To view this figure in colour, please see the online version)
Figure 5.
Figure 5.
Experiment 1, blur detection low-pass filtering cut-off thresholds (in cpd) as a function of retinal eccentricity (in degrees visual angle) and cognitive load (in terms of N-back level, or control condition). Results shown for individual participants (1–3) and their overall mean. Error bars = 95% CI of the mean. (To view this figure in colour, please see the online version)
Figure 6.
Figure 6.
Experiment 1, blur detection low-pass filtering cut-off thresholds (in cpd) as a function of cognitive load (in terms of N-back level, or control condition) and retinal eccentricity (in degrees visual angle). Results shown for individual participants (1–3) and their overall mean. Error bars = 95% CI of the mean.
Figure 7.
Figure 7.
Trial schematic of Experiment 2, showing one pair of target/catch images for the 9° eccentricity. The participant was required to fixate the centre of the screen to initiate the trial, followed by a central fixation screen in which the participant had to maintain gaze at the centre of the screen in order for the following presentation to be considered valid. (To view this figure in colour, please see the online version)
Figure 8.
Figure 8.
Experiment 2, N-back sensitivity (d’) as a function of N. Results shown for individual participants (1–3) and their overall mean. Error bars = 95% CI of the mean. (To view this figure in colour, please see the online version)
Figure 9.
Figure 9.
Experiment 2, blur detection low-pass filtering cut-off thresholds (in cpd) as a function of retinal eccentricity (in degrees visual angle) and cognitive load (in terms of N-back level, or control condition). Results shown for individual participants (1–3) and their overall mean. Error bars = 95% CI of the mean. (To view this figure in colour, please see the online version)
Figure 10.
Figure 10.
Experiment 2, blur detection low-pass filtering cut-off thresholds (in cpd) as a function of cognitive load (in terms of N-back level, or control condition) and retinal eccentricity (in degrees visual angle). Results shown for individual participants (1–3) and their overall mean (see inset). Error bars = 95% CI of the mean.

References

    1. Bernard J.-B., Scherlen A-C., Castet E. Page mode reading with simulated scotomas: A modest effect of interline spacing on reading speed. Vision Research. 2007;47(28):3447–3459. doi:10.1016/j.visres.2007.10.005. - PubMed
    1. Carrasco M., Ling S., Read S. Attention alters appearance. Nature Neuroscience. 2004;7(3):308–313. doi:10.1038/nn1194. - PMC - PubMed
    1. Carrasco M., Williams P. E., Yeshurun Y. Covert attention increases spatial resolution with or without masks: Support for signal enhancement. Journal of Vision. 2002;2(6):467–479. doi:10.1167/2.6.4. - PubMed
    1. Chen Y.-N., Mitra S., Schlaghecken F. Sub-processes of working memory in the N-back task: An investigation using ERPs. Clinical Neurophysiology. 2008;119(7):1546–1559. doi:10.1016/j.clinph.2008.03.003. - PubMed
    1. Ciuffreda K. J., Wang B., Vasudevan B. Depth-of-focus: Control system implications. Computers in Biology and Medicine. 2007;37(7):919–923. doi:10.1016/j.compbiomed.2006.06.012. - PubMed