. 2014;10(3):473-483.
doi: 10.1007/s11306-013-0588-8. Epub 2013 Oct 13.

Integrated MALDI-MS imaging and LC-MS techniques for visualizing spatiotemporal metabolomic dynamics in a rat stroke model

Affiliations

Integrated MALDI-MS imaging and LC-MS techniques for visualizing spatiotemporal metabolomic dynamics in a rat stroke model

Miho Irie et al. Metabolomics. 2014.

Abstract

Spatiotemporal information about biomolecules is indispensable for precise pathological analysis, but it remains largely unclear. Here we show a novel analytical platform combing mass spectrometry imaging (MSI) with its complementary technique, liquid chromatography-mass spectrometry (LC-MS), to elucidate more comprehensive metabolic behaviors, with spatiotemporal information, in tissues. Analysis of a rat transient middle cerebral artery occlusion (MCAO) brain tissue after ischemia-reperfusion was performed to characterize the detailed metabolomic response to pathological alterations. To compare the spatially resolved metabolic state between ischemic and contralateral hemispheres of the MCAO brain, coronally sliced tissues were subjected to MSI. We also measured the metabolites extracted from three different cerebral regions, including whole cortex (CTX), hippocampus (HI) and corpus striatum (CPu), by LC-MS. In the ischemic hemisphere, significant metabolic changes at the CTX and CPu were observed after reperfusion, while not at the HI. A region-specific metabolic behavior was observed in amino acid and nucleotide metabolism, as well as in the TCA cycle. Correlation between MSI and LC-MS data was relatively high in the CTX and CPu. Combination of both MS platforms visualized the diverse spatiotemporal metabolic dynamics during pathological progress. Thus, our proposed strategy will contribute to the understanding of the complex pathogenesis of ischemia-reperfusion.

Keywords: LC–MS; MSI; Metabolomic dynamics; Pathological analysis; Spatiotemporal behavior; Stroke.


Figures

Fig. 1
Fig. 1
A schematic diagram of the sampling areas for the MSI and LC–MS analyses. Rat brain tissue samples were collected 0, 3 and 24 h after reperfusion following 1 h of MCAO. A schematic illustration represents the structures of the sagittally (a) and coronally (b) sectioned brains. In both the contralateral (Con.) and ischemic (Isc.) hemispheres, the whole cerebral cortex (CTX), hippocampus (HI) and corpus striatum (CPu) were enucleated from the brain for the LC–MS analysis. Coronal brain sections, including the CTX, CPu and HI, were subjected to the MSI analysis
Fig. 2
Fig. 2
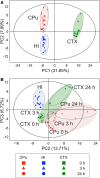
The multivariate analysis of cerebral metabolomic changes induced by reperfusion following 1 h MCAO. The CPu (red), HI (blue) and CTX (green) extracts from the contralateral (a) and ischemic hemispheres (b) at 0 h (square), 3 h (triangle) and 24 h (circle) after reperfusion were measured by LC–MS, and the resulting MS spectral data were subjected to an exploratory data analysis (PCA). The separate score plot is shown for each hemisphere’s data sets
Fig. 3
Fig. 3
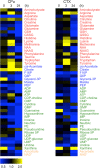
Heat map visualization of the common metabolites identified in two brain components during ischemia–reperfusion. Data were obtained by the average intensity ratio (ischemic hemisphere/contralateral hemisphere) from the LC–MS analysis. The data of 47 common metabolites detected in the CTX and CPu were visualized. The normalized mean values were displayed using the MultiExperiment Viewer (http://www.tm4.org). The colored letters for the heat map are as follows: amino acids (red), central metabolism intermediates (blue), nucleic acids (green), other metabolites (orange)
Fig. 4
Fig. 4
A comparison of the average intensity between the whole tissue regions and partial tissue regions. The average intensity of the whole tissue region is represented as the average intensity ratio (ischemic hemisphere/contralateral hemisphere) for each whole tissue region (LC–MS data, see Fig. 1a). The regional average intensity of a partial tissue region is represented as the average intensity of each region on 10 μm slices (MSI data, see Fig. 1b). In the heat map, 12 common metabolites detected by LC–MS and MSI were visualized. The normalized mean values were displayed using the MultiExperiment Viewer (http://www.tm4.org). The colored letters for the heat map are as follows: amino acids (red), central metabolism intermediates (blue), nucleic acids (green), other metabolites (orange)
Fig. 5
Fig. 5
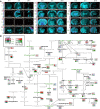
The integrated MSI and LC–MS techniques allow the visualization of drastic changes in the spatiotemporal metabolite distribution. a In situ MSI visualized dramatic changes in the spatiotemporal metabolite distribution in the MCAO rat brain. Metabolites related to nucleotide and amino acid metabolism, as well as the central pathway, were simultaneously visualized in a single MSI experiment. Scale bar 1.0 mm. Data (No. 1–7) were reprinted with permission from the author (Miura et al. 2010b). b Comparative visualization of the central metabolic pathway and its peripheral metabolic pathways in the CPu (upper box, red) and CTX (lower box, green) in the MCAO rat brain, as determined by LC–MS. Significant differences (Student’s t test, *P < 0.05) are indicated by asterisks on the colored boxes. Black and grey letters indicate LC–MS-detected metabolites and unmeasured metabolites, respectively. Green letters indicate metabolites detected by both LC–MS and MSI. Solid arrows represent a single step connecting two metabolites, and dotted arrows represent multiple steps

References

    1. Abe K, Araki T, Kogure K. Recovery from edema and of protein synthesis differs between the cortex and caudate following transient focal cerebral ischemia in rats. Journal of Neurochemistry. 1988;51:1470–1476. doi: 10.1111/j.1471-4159.1988.tb01113.x. - DOI - PubMed
    1. Amstalden van Hove ER, Smith DF, Heeren RM. A concise review of mass spectrometry imaging. Journal of Chromatography A. 2010;1217:3946–3954. doi: 10.1016/j.chroma.2010.01.033. - DOI - PubMed
    1. Bromont C, Marie C, Bralet J. Increased lipid peroxidation in vulnerable brain regions after transient forebrain ischemia in rats. Stroke. 1989;20:918–924. doi: 10.1161/01.STR.20.7.918. - DOI - PubMed
    1. Bylund-Fellenius AC, Ojamaa KM, Flaim KE, Li JB, Wassner SJ, Jefferson LS. Protein synthesis versus energy state in contracting muscles of perfused rat hindlimb. American Journal of Physiology. 1984;246:E297–305. - PubMed
    1. Caprioli RM, Farmer TB, Gile J. Molecular imaging of biological samples: Localization of peptides and proteins using MALDI-TOF MS. Analytical Chemistry. 1997;69:4751–4760. doi: 10.1021/ac970888i. - DOI - PubMed

LinkOut - more resources