

doi: 10.3389/fncir.2014.00029.
eCollection 2014.
Simultaneous imaging of neural activity in three dimensions
Affiliations
- PMID: 24772066
- PMCID: PMC3982072
- DOI: 10.3389/fncir.2014.00029
Item in Clipboard
Simultaneous imaging of neural activity in three dimensions
Front Neural Circuits.
.
Abstract
We introduce a scanless optical method to image neuronal activity in three dimensions simultaneously. Using a spatial light modulator and a custom-designed phase mask, we illuminate and collect light simultaneously from different focal planes and perform calcium imaging of neuronal activity in vitro and in vivo. This method, combining structured illumination with volume projection imaging, could be used as a technological platform for brain activity mapping.
Keywords: brain activity map; calcium imaging; spatial-light-modulator; three-dimensional imaging; volume imaging.
Figures
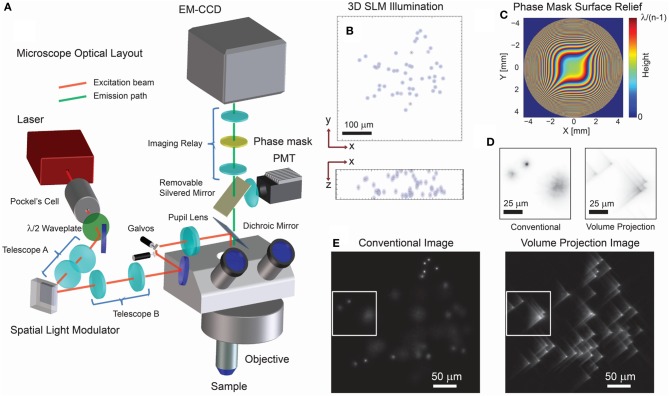
Optical layout and characteristics of 3D projection-based imaging. (A) The optical configuration comprises an illumination path which incorporates a SLM for 3D structured illumination and a modified imaging path using a phase mask (PM) to suppress the imaging effect of defocus. (B) An example 3D illumination pattern using a 20x/0.5NA objective. (C) Ideal surface profile modulation of the phase mask. (D) Experimental imaging results using a transparent fluorescent slab demonstrate that the volume projection imaging path results in clearer separation of the region-of-interest signals when compared with the conventional imaging path. Note that the contrast conserves the number of photons in each image. (E) Wide-field imaging results comparing the conventional and volume projection imaging techniques. Note that each image is normalized to the respective peak signal.
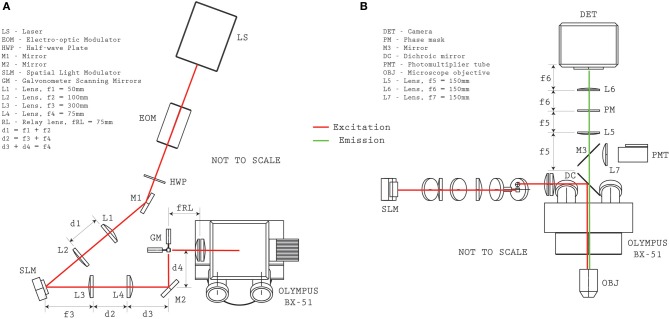
Optical system configuration. Plan (A) and elevation (B) views provide the relative distances between optical elements for reproducing the microscope configuration.
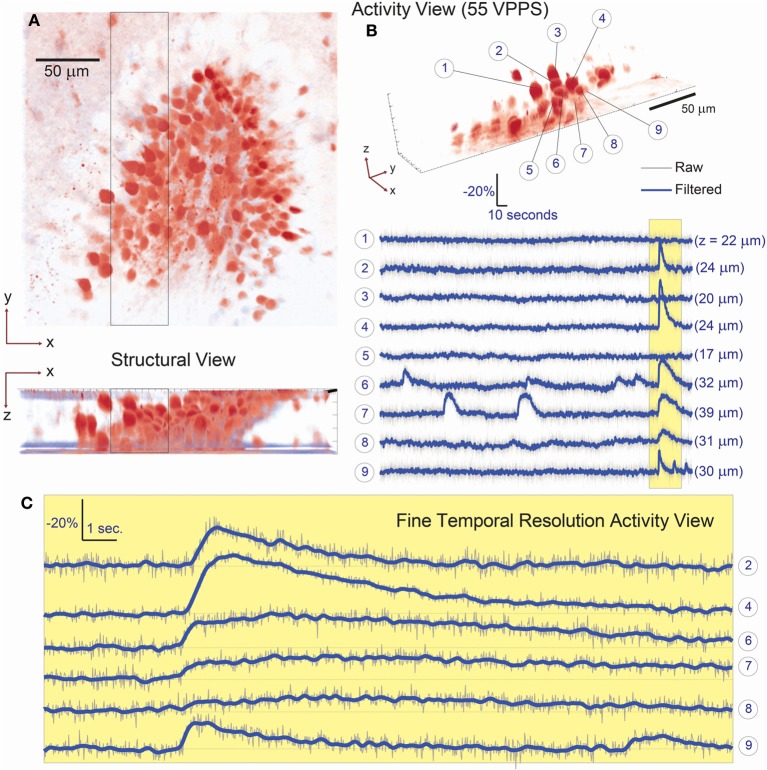
Simultaneous 3D imaging of hippocampal neuronal activity in vitro at 55 volume projections per second. (A) 3D structural data acquired by two-photon raster-scanning image stack. (B) 3D functional imaging with single cell resolution, where 9 of 107 total cells are selected from the 3D volume [boxed region of (A)] and their respective activity is given in (B). Despite simultaneous burst activity in 5 of the neighboring cells, independent calcium transients are detectable. The axial location of each cell is given in parenthesis behind the respective fluorescence trace. (C) A fine-temporal resolution view of the burst activity highlights the variability in both the temporal and amplitude modulation of the calcium transients.
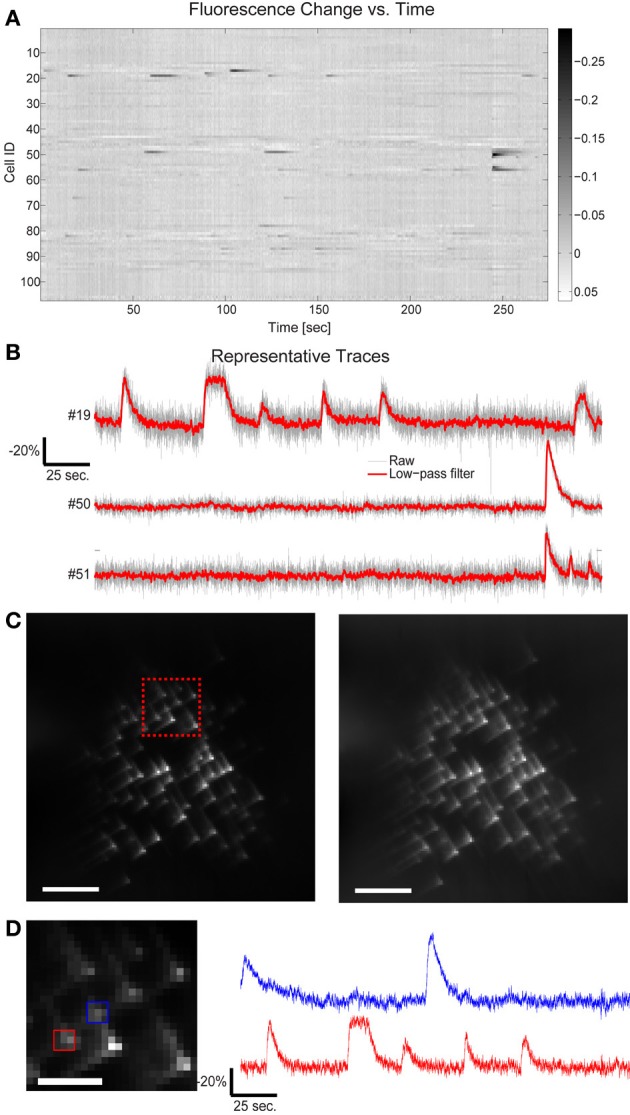
Fluorescence change vs. time for all targets in Figure 3. (A) 109 cells have been targeted by 109 focal spots in the 3D volume and the relative fluorescence change of each targeted location is displayed. Data has been low-pass filtered by a convolution with a Gaussian filter of σ = 92 ms. (B) A few representative traces indicate the SNR available by this method. (C) Five second average of the raw acquired images, illustrating both the characteristic cubic-phase aberration and the readily identifiable individual targets. Left image red inset shows area magnified in 4d, right frame is the same image, contrast adjusted to highlight dim features. Scale bar is 40 μm in both images. (D) Magnified area of image in (C), showing dense targeting, and again illustrating the cubic-phase aberration. Scale bar is 15 μm. Red and blue boxes indicate ROIs used to generate traces shown on the right, using “traditional” DF/F signal extraction, without fitting. The red trace corresponds to cell #19 in (B), and displays nearly identical absolute modulation and SNR. Note the near absence of crosstalk between the traces, although laterally, the two sources are separated by ~10 μm. Traces are low-pass filtered as in (A).
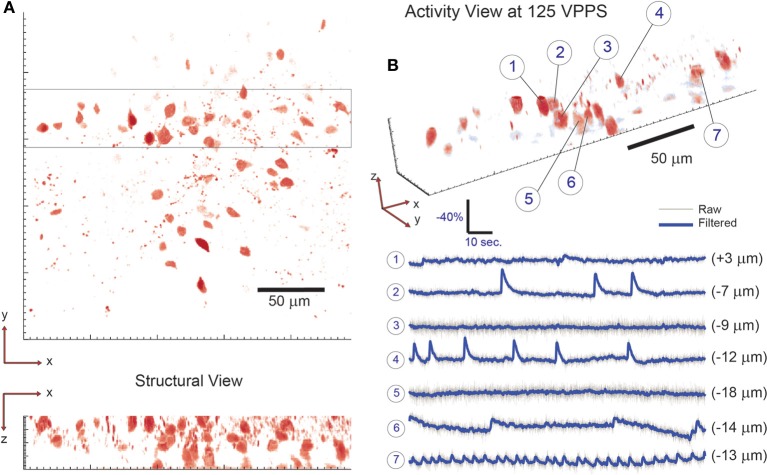
3D imaging of neuronal activity in dentate gyrus with single-cell resolution at 125 volume projections per second. (A) The location of neuronal cells within the volume of interest is determined by collecting a two-photon raster-scanning image stack and identifying cell bodies. To demonstrate 3D sensing capability with single-cell resolution, 7 neighboring cells are selected from the 3D sub-volume highlighted in (A) and their respective activity is shown in (B). Note that neighboring cells are seen to have independent activity—confirming single-cell resolution. The axial location of each cell is given in parenthesis behind the respective fluorescence trace. 58 total targets were monitored (out of 61 total labeled cells identified via visual inspection) throughout the tissue volume.
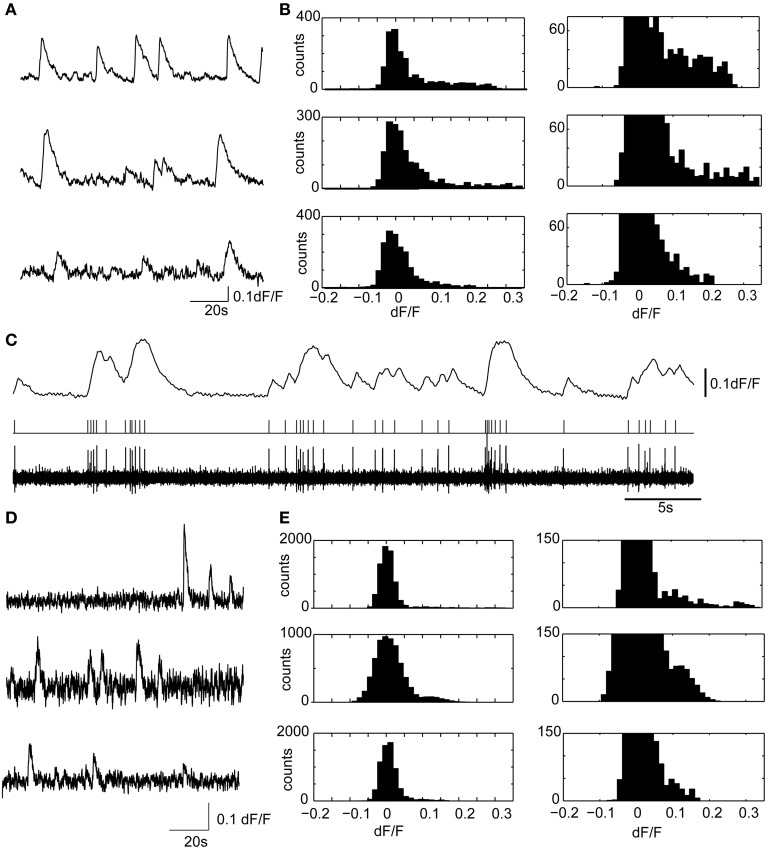
Calcium transients in hippocampal slices display similar amplitudes and kinetics with confocal microscopy and volume projection 3D imaging. (A) Example calcium transients from three representative granule cell ROIs, acquired from the dentate gyrus, using a spinning disk confocal microscope. The sample preparation was identical to the brain slice experiments described in the main text. Only a short 2 min segment of the data is shown. Data were acquired at 20 fps. (B) (Left) dF/F distributions for the three ROIs shown in (A). On the right is the y-axis zoomed histogram, shown to highlight the positively skewed dF/F distributions characteristic of active neuron spiking. (C) A representative experiment showing the ability of Fura-2AM calcium transients to faithfully resolve action potential firing in a cell attached recording. The deconvolved calcium dynamics (above) from a cell recording in cell attached are shown (below) with the filtered (0.2–4 kHz) cell attached recording and threshold crossing spikes. Note the ability of the Fura-2AM to resolve single action potential firing, which was usually accompanied by a 5% dF/F. Therefore, in most experiments, single, or at minimum doublet spiking would be detected using calcium imaging. (D,E) The same as (A,B), but with three examples of ROIs measured using the 3D volume projection imaging system described in the manuscript. Data displayed were acquired at 55VPPS, and smoothed with a Gaussian filter to match the sample rate of the confocal images. Note the similar shape calcium transients (D), and dF/F distributions (E). The different size calcium dynamics and the dF/F distributions suggest that single or at minimum doublet spiking can be resolved with the volume projection imaging technique.
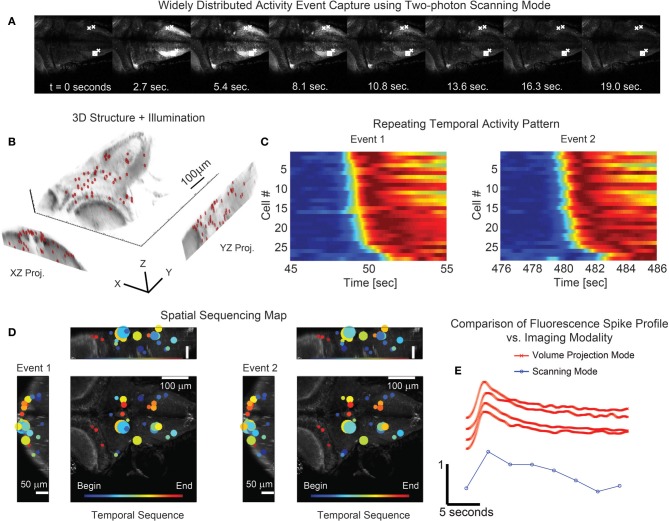
Simultaneous 3D imaging of neuronal activity of zebrafish in vivo at 30 volume projections per second. (A) Conventional single plane two-photon raster-scan data acquisition reveals sequences of coordinated whole-brain activity. (B) 49 targets are distributed throughout an acquisition volume of 284 × 270 × 114 μm to sample activity in 3D. (C) Multiple repetitions of these events occur and exhibit similar time-courses. (D) The associated spatial patterns of the events confirm that the activity has repetitive structure. The size of the marker is indicative of the amplitude of signal modulation at each location. (E) Comparison of the fluorescence spike time profile between the two imaging modalities shows the signal of the volume projection technique to be consistent with the two-photon scanning acquisition. The scanning mode data series was taken from the box marked area in (A) while the four volume projection mode series' were taken from the x marked areas. Note that the fluorescence signal has been normalized in each time series of (C) and (E) for visualization.
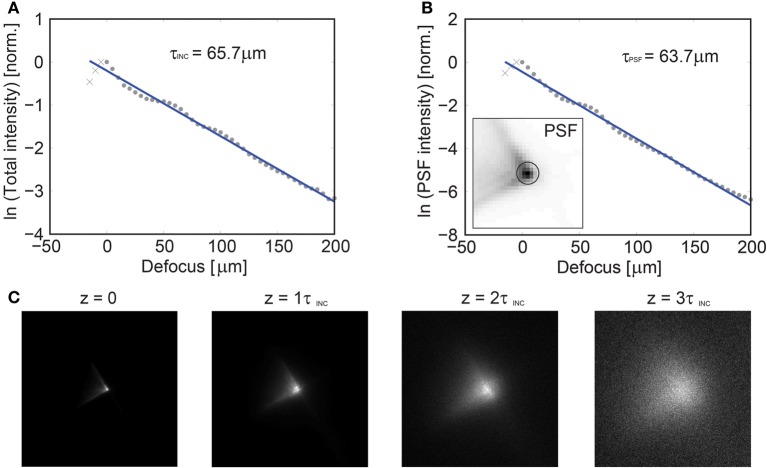
Axial dependence of the imaging PSF vs. depth in scattering tissue. Characterization of the imaging performance of volume projection imaging using GCaMP6s labeled tissue at P31 in white matter tissue. GCaMP6s was chosen to provide near uniform labeling throughout the tissue. (A) A focused spot was translated axially via a mechanical stage and the resulting collected intensity is reported, yielding a mean scattering length of the incident illumination (λ = 920 nm) of τINC = 65.7 μm. In an attempt to quantify the loss of the PSF fidelity with increasing scattering, a circular region was defined [centered on the peak intensity, insert (B)] and the relative loss of energy was plotted as a function of depth, yielding τPSF = 63.7 μm (B). An image of the PSF is given as a function of τINC in (C) and the PSF fidelity is observed to degenerate by ~3τINC, at which point the system performance approaches that of a conventional SLM microscope.
References
Publication types
MeSH terms
Grants and funding
LinkOut - more resources
Full Text Sources
Other Literature Sources