

Vasovagal oscillations and vasovagal responses produced by the vestibulo-sympathetic reflex in the rat
- PMID: 24772102
- PMCID: PMC3983498
- DOI: 10.3389/fneur.2014.00037
Vasovagal oscillations and vasovagal responses produced by the vestibulo-sympathetic reflex in the rat
Abstract
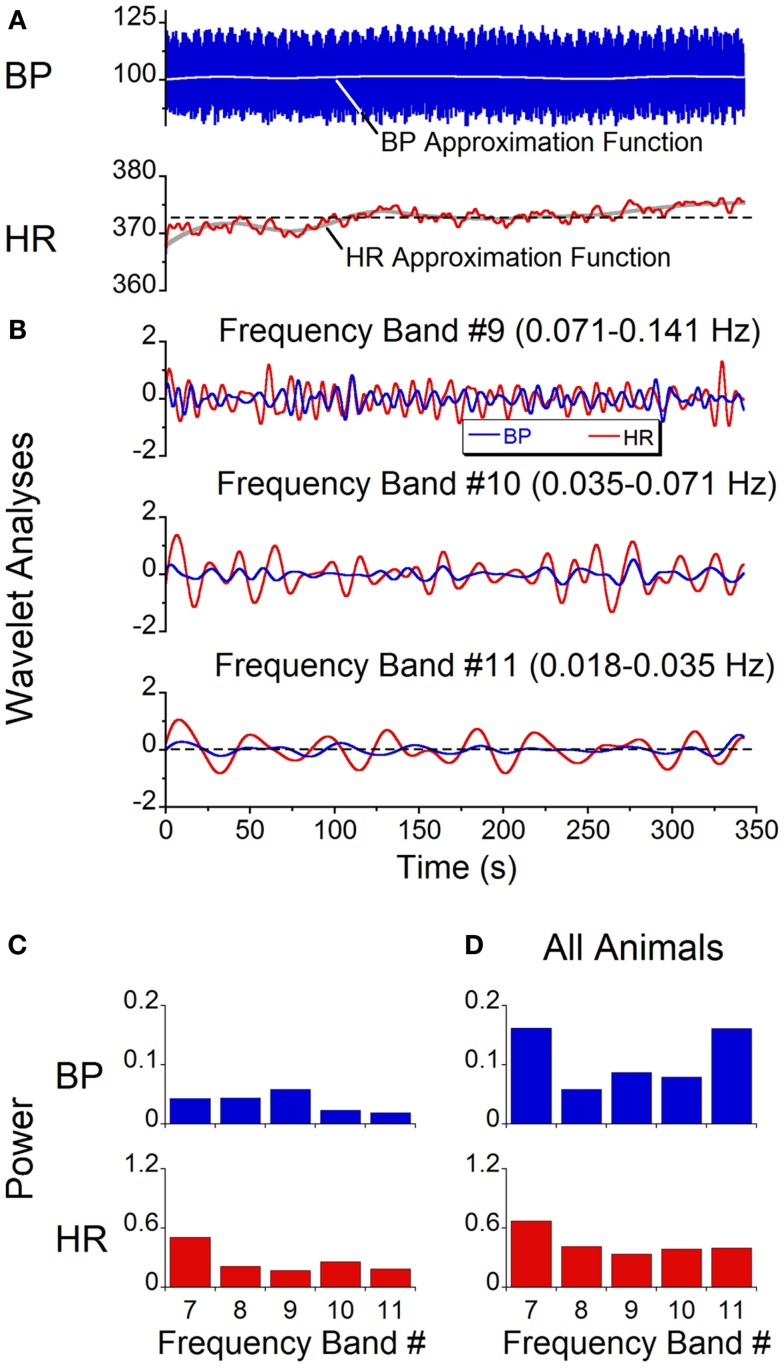
Sinusoidal galvanic vestibular stimulation (sGVS) induces oscillations in blood pressure (BP) and heart rate (HR), i.e., vasovagal oscillations, as well as transient decreases in BP and HR, i.e., vasovagal responses, in isoflurane-anesthetized rats. We determined the characteristics of the vasovagal oscillations, assessed their role in the generation of vasovagal responses, and determined whether they could be induced by monaural as well as by binaural sGVS and by oscillation in pitch. Wavelet analyses were used to determine the power distributions of the waveforms. Monaural and binaural sGVS and pitch generated vasovagal oscillations at the frequency and at twice the frequency of stimulation. Vasovagal oscillations and vasovagal responses were maximally induced at low stimulus frequencies (0.025-0.05 Hz). The oscillations were attenuated and the responses were rarely induced at higher stimulus frequencies. Vasovagal oscillations could occur without induction of vasovagal responses, but vasovagal responses were always associated with a vasovagal oscillation. We posit that the vasovagal oscillations originate in a low frequency band that, when appropriately activated by strong sympathetic stimulation, can generate vasovagal oscillations as a precursor for vasovagal responses and syncope. We further suggest that the activity responsible for the vasovagal oscillations arises in low frequency, otolith neurons with orientation vectors close to the vertical axis of the head. These neurons are likely to provide critical input to the vestibulo-sympathetic reflex to increase BP and HR upon changes in head position relative to gravity, and to contribute to the production of vasovagal oscillations and vasovagal responses and syncope when the baroreflex is inactivated.
Keywords: isoflurane anesthesia; otolith; rat; sinusoidal galvanic vestibular stimulation; syncope; wavelet analysis.
Figures


Similar articles
-
Sinusoidal galvanic vestibular stimulation (sGVS) induces a vasovagal response in the rat.Exp Brain Res. 2011 Apr;210(1):45-55. doi: 10.1007/s00221-011-2604-4. Epub 2011 Mar 4. Exp Brain Res. 2011. PMID: 21374078 Free PMC article.
-
Vestibular Activation Habituates the Vasovagal Response in the Rat.Front Neurol. 2017 Mar 15;8:83. doi: 10.3389/fneur.2017.00083. eCollection 2017. Front Neurol. 2017. PMID: 28360882 Free PMC article.
-
Fos expression in neurons of the rat vestibulo-autonomic pathway activated by sinusoidal galvanic vestibular stimulation.Front Neurol. 2012 Feb 28;3:4. doi: 10.3389/fneur.2012.00004. eCollection 2012. Front Neurol. 2012. PMID: 22403566 Free PMC article.
-
Sustained and Transient Vestibular Systems: A Physiological Basis for Interpreting Vestibular Function.Front Neurol. 2017 Mar 30;8:117. doi: 10.3389/fneur.2017.00117. eCollection 2017. Front Neurol. 2017. PMID: 28424655 Free PMC article. Review.
-
Neural monitoring of vasovagal syncope.Pacing Clin Electrophysiol. 1997 Mar;20(3 Pt 2):788-94. doi: 10.1111/j.1540-8159.1997.tb03905.x. Pacing Clin Electrophysiol. 1997. PMID: 9080511 Review.
Cited by
-
The response of the vestibulosympathetic reflex to linear acceleration in the rat.J Neurophysiol. 2016 Dec 1;116(6):2752-2764. doi: 10.1152/jn.00217.2016. Epub 2016 Sep 28. J Neurophysiol. 2016. PMID: 27683882 Free PMC article.
-
An Experimental Model of Vasovagal Syncope Induces Cerebral Hypoperfusion and Fainting-Like Behavior in Awake Rats.PLoS One. 2016 Sep 22;11(9):e0163280. doi: 10.1371/journal.pone.0163280. eCollection 2016. PLoS One. 2016. PMID: 27658057 Free PMC article.
-
A Model of Blood Pressure, Heart Rate, and Vaso-Vagal Responses Produced by Vestibulo-Sympathetic Activation.Front Neurosci. 2016 Mar 31;10:96. doi: 10.3389/fnins.2016.00096. eCollection 2016. Front Neurosci. 2016. PMID: 27065779 Free PMC article.
-
Predicting Vasovagal Responses: A Model-Based and Machine Learning Approach.Front Neurol. 2021 Mar 10;12:631409. doi: 10.3389/fneur.2021.631409. eCollection 2021. Front Neurol. 2021. PMID: 33776889 Free PMC article.
-
Autonomic laterality in caloric vestibular stimulation.World J Cardiol. 2020 Apr 26;12(4):144-154. doi: 10.4330/wjc.v12.i4.144. World J Cardiol. 2020. PMID: 32431785 Free PMC article.
References
-
- Darwin E. Zoonomia; or, the Laws of Organic Life. London: J. Johnson; (1796).
Grants and funding
LinkOut - more resources
Full Text Sources
Other Literature Sources
Medical