

A Bayesian Approach for the Cox Proportional Hazards Model with Covariates Subject to Detection Limit
- PMID: 24772198
- PMCID: PMC3998726
- DOI: 10.6000/1929-6029.2014.03.01.5
A Bayesian Approach for the Cox Proportional Hazards Model with Covariates Subject to Detection Limit
Abstract
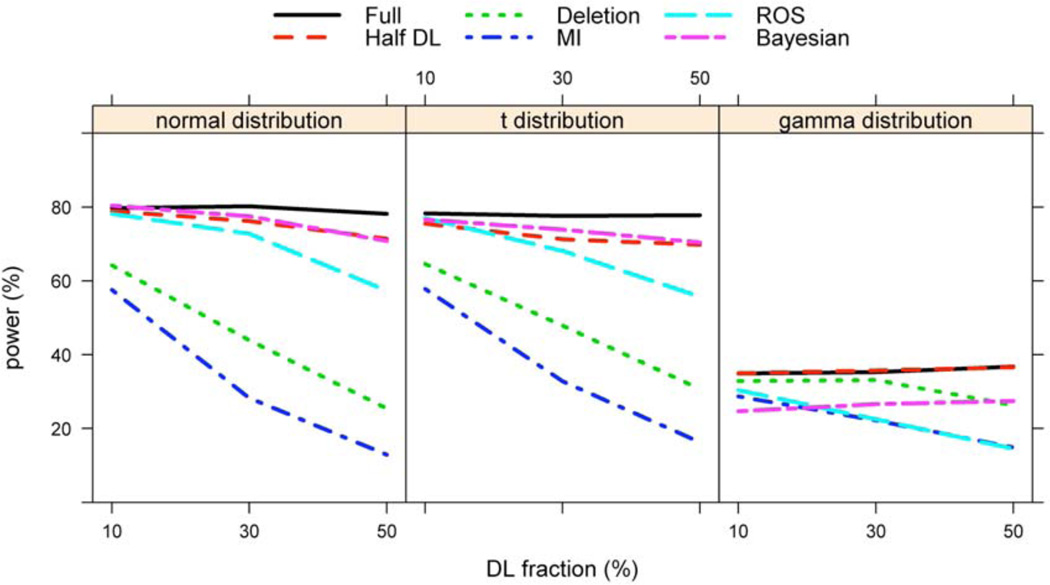
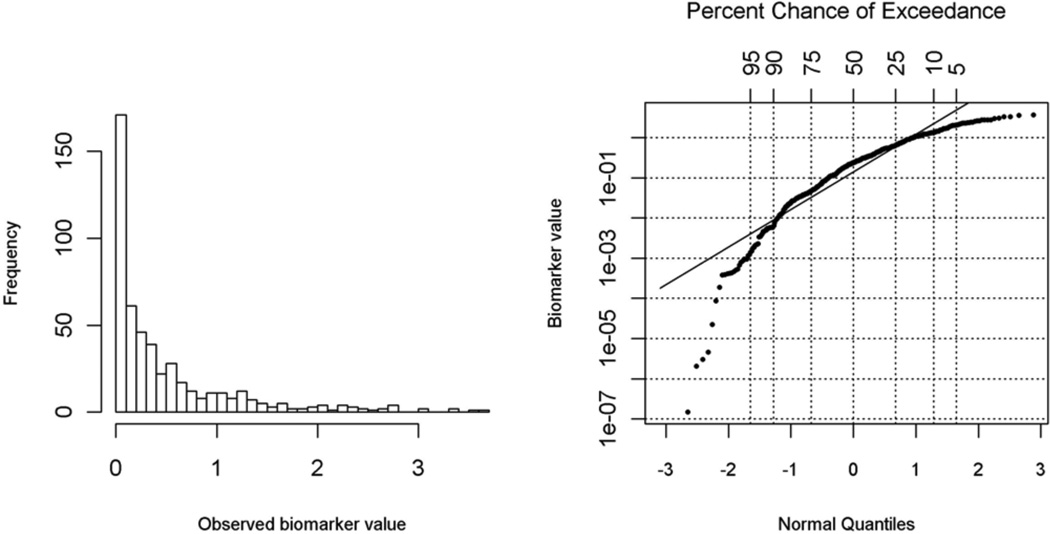
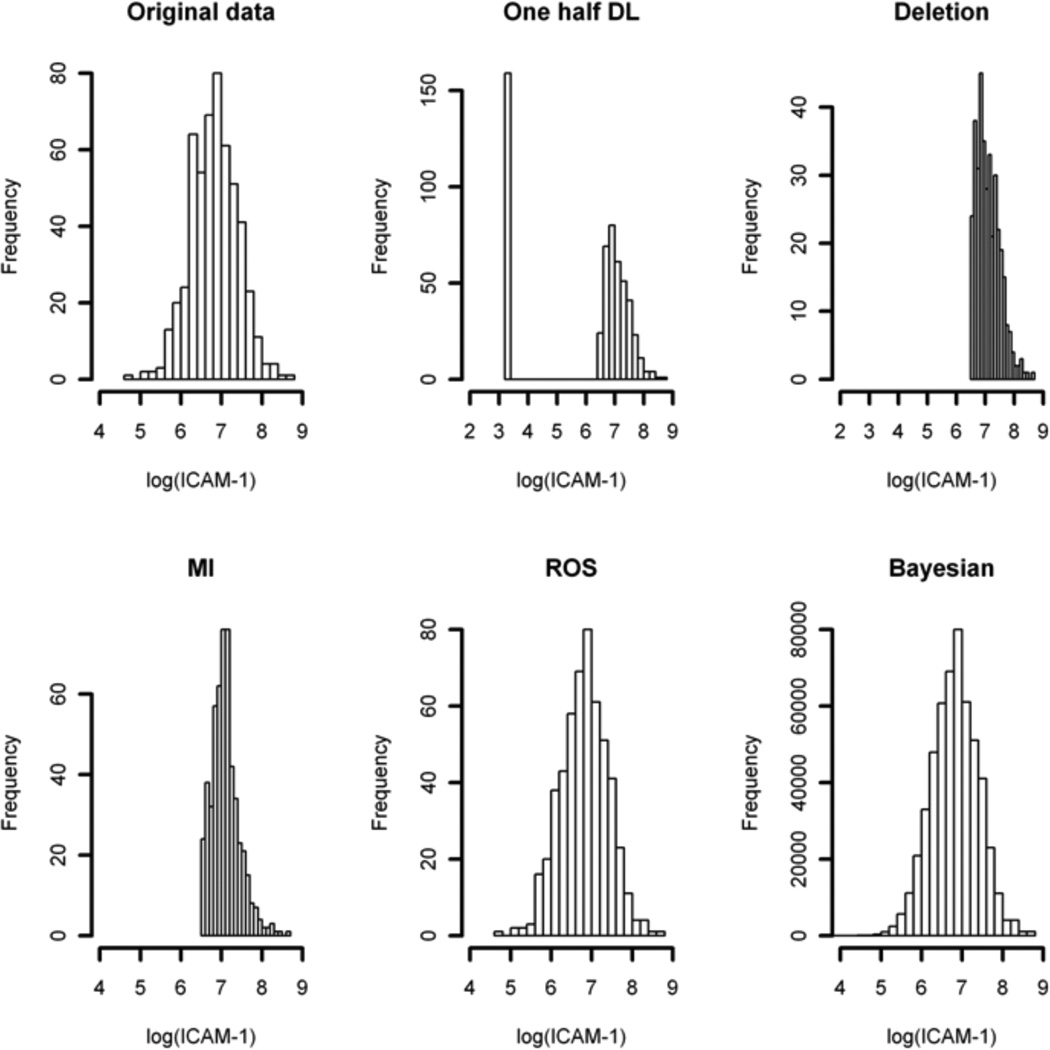
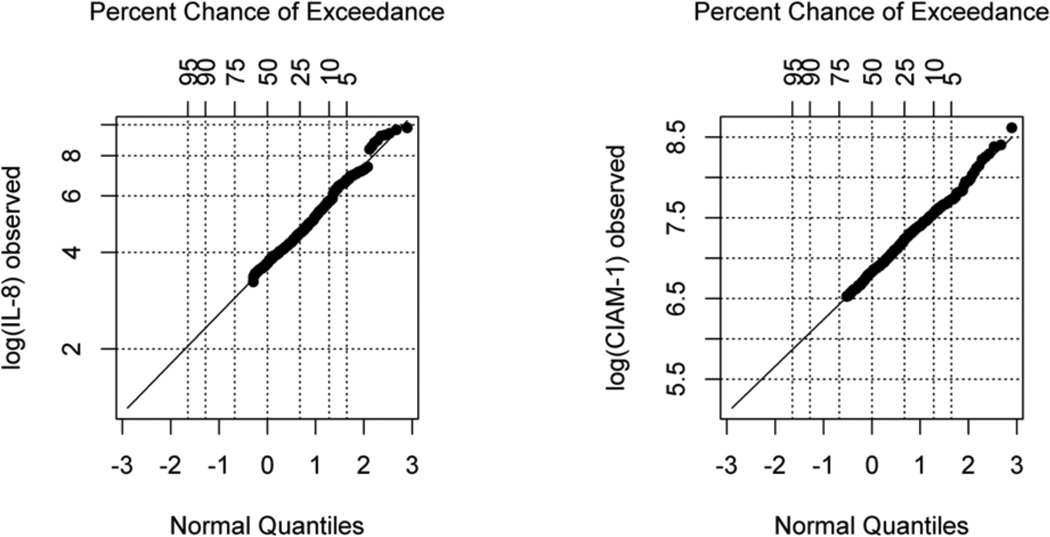
The research on biomarkers has been limited in its effectiveness because biomarker levels can only be measured within the thresholds of assays and laboratory instruments, a challenge referred to as a detection limit (DL) problem. In this paper, we propose a Bayesian approach to the Cox proportional hazards model with explanatory variables subject to lower, upper, or interval DLs. We demonstrate that by formulating the time-to-event outcome using the Poisson density with counting process notation, implementing the proposed approach in the OpenBUGS and JAGS is straightforward. We have conducted extensive simulations to compare the proposed Bayesian approach to the other four commonly used methods and to evaluate its robustness with respect to the distribution assumption of the biomarkers. The proposed Bayesian approach and other methods were applied to an acute lung injury study, in which a panel of cytokine biomarkers was studied for the biomarkers' association with ventilation-free survival.
Keywords: Bayesian; Biomarker; Detection limit; Lung Injury; Proportional hazards models.
Figures
Similar articles
-
A Bayesian Approach for Generalized Linear Models with Explanatory Biomarker Measurement Variables Subject to Detection Limit - an Application to Acute Lung Injury.J Appl Stat. 2012;39(8):1733-1747. doi: 10.1080/02664763.2012.681362. Epub 2012 Apr 24. J Appl Stat. 2012. PMID: 23049157 Free PMC article.
-
Estimation of C-index for cox proportional hazards model with censored biomarker covariate subject to limits of detection.J Biopharm Stat. 2015;25(3):459-73. doi: 10.1080/10543406.2014.920859. J Biopharm Stat. 2015. PMID: 24896647
-
Data generation for the Cox proportional hazards model with time-dependent covariates: a method for medical researchers.Stat Med. 2014 Feb 10;33(3):436-54. doi: 10.1002/sim.5945. Epub 2013 Sep 9. Stat Med. 2014. PMID: 24014094
-
Application of random survival forests in understanding the determinants of under-five child mortality in Uganda in the presence of covariates that satisfy the proportional and non-proportional hazards assumption.BMC Res Notes. 2017 Sep 7;10(1):459. doi: 10.1186/s13104-017-2775-6. BMC Res Notes. 2017. PMID: 28882171 Free PMC article.
-
How are missing data in covariates handled in observational time-to-event studies in oncology? A systematic review.BMC Med Res Methodol. 2020 May 29;20(1):134. doi: 10.1186/s12874-020-01018-7. BMC Med Res Methodol. 2020. PMID: 32471366 Free PMC article.
Cited by
-
Cox regression model with randomly censored covariates.Biom J. 2019 Jul;61(4):1020-1032. doi: 10.1002/bimj.201800275. Epub 2019 Mar 25. Biom J. 2019. PMID: 30908720 Free PMC article.
-
Challenges of Modeling Outcomes for Surgical Infections: A Word of Caution.Surg Infect (Larchmt). 2021 Jun;22(5):523-531. doi: 10.1089/sur.2020.208. Epub 2020 Oct 20. Surg Infect (Larchmt). 2021. PMID: 33085571 Free PMC article.
-
A calibrated Bayesian method for the stratified proportional hazards model with missing covariates.Lifetime Data Anal. 2022 Apr;28(2):169-193. doi: 10.1007/s10985-021-09542-4. Epub 2022 Jan 16. Lifetime Data Anal. 2022. PMID: 35034213 Free PMC article.
-
Semiparametric analysis of a generalized linear model with multiple covariates subject to detection limits.Stat Med. 2022 Oct 30;41(24):4791-4808. doi: 10.1002/sim.9536. Epub 2022 Jul 31. Stat Med. 2022. PMID: 35909228 Free PMC article.
-
A comparison of computational algorithms for the Bayesian analysis of clinical trials.Clin Trials. 2024 Dec;21(6):689-700. doi: 10.1177/17407745241247334. Epub 2024 May 16. Clin Trials. 2024. PMID: 38752434 Free PMC article.
References
-
- Baker M. In biomarkers we trust? Nature biotechnology. 2005;23(3):297–304. http://dx.doi.org/10.1038/nbt0305-297. - DOI - PubMed
-
- Ray P, et al. Statistical evaluation of a biomarker. Anesthesiology. 2010;112(4):1023–1040. http://dx.doi.org/10.1097/ALN.0b013e3181d47604. - DOI - PubMed
-
- Morikawa T, et al. Association of CTNNB1 (β-catenin) alterations, body mass index, and physical activity with survival in patients with colorectal cancer. JAMA: the journal of the American Medical Association. 2011;305(16):1685–1694. http://dx.doi.org/10.1001/jama.2011.513. - DOI - PMC - PubMed
-
- Braunwald E. Biomarkers in heart failure. New Engl J Med. 2008;358(20):2148–2159. http://dx.doi.org/10.1056/NEJMra0800239. - DOI - PubMed
Grants and funding
LinkOut - more resources
Full Text Sources
Other Literature Sources