

Errors in Quantitative Image Analysis due to Platform-Dependent Image Scaling
- PMID: 24772209
- PMCID: PMC3998685
- DOI: 10.1593/tlo.13811
Errors in Quantitative Image Analysis due to Platform-Dependent Image Scaling
Erratum in
-
Erratum to "Errors in Quantitative Image Analysis due to Platform-Dependent Image Scaling," published in Translational Oncology, Volume 7, No. 1 on pages 65-71.Transl Oncol. 2014 Aug;7(4):523. doi: 10.1016/j.tranon.2014.05.003. Transl Oncol. 2014. PMID: 25171893 Free PMC article. No abstract available.
Abstract
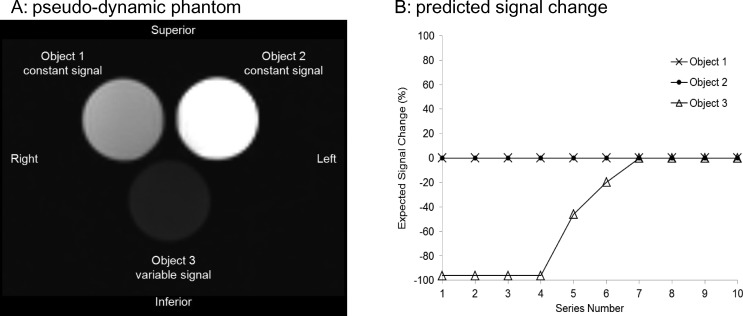
Purpose: To evaluate the ability of various software (SW) tools used for quantitative image analysis to properly account for source-specific image scaling employed by magnetic resonance imaging manufacturers.
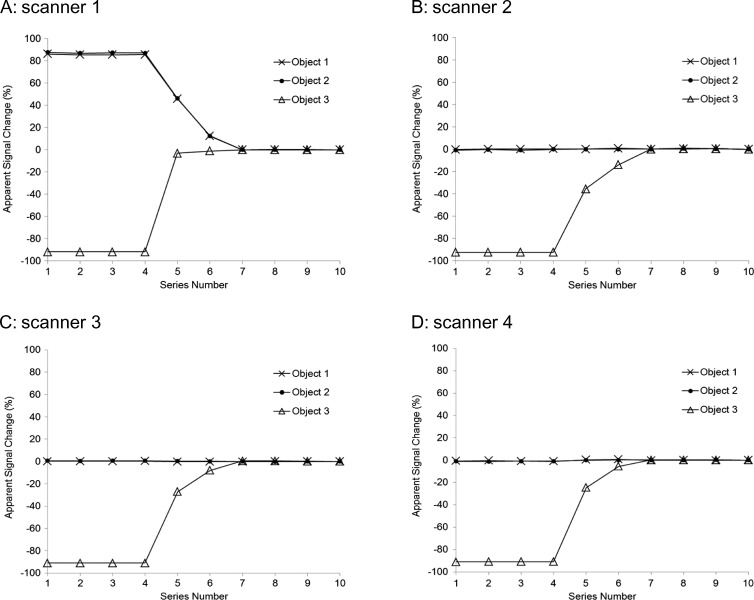
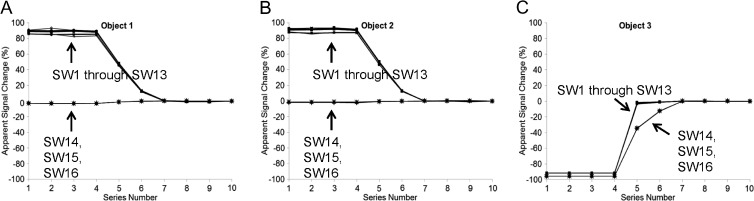
Methods: A series of gadoteridol-doped distilled water solutions (0%, 0.5%, 1%, and 2% volume concentrations) was prepared for manual substitution into one (of three) phantom compartments to create "variable signal," whereas the other two compartments (containing mineral oil and 0.25% gadoteriol) were held unchanged. Pseudodynamic images were acquired over multiple series using four scanners such that the histogram of pixel intensities varied enough to provoke variable image scaling from series to series. Additional diffusion-weighted images were acquired of an ice-water phantom to generate scanner-specific apparent diffusion coefficient (ADC) maps. The resulting pseudodynamic images and ADC maps were analyzed by eight centers of the Quantitative Imaging Network using 16 different SW tools to measure compartment-specific region-of-interest intensity.
Results: Images generated by one of the scanners appeared to have additional intensity scaling that was not accounted for by the majority of tested quantitative image analysis SW tools. Incorrect image scaling leads to intensity measurement bias near 100%, compared to nonscaled images.
Conclusion: Corrective actions for image scaling are suggested for manufacturers and quantitative imaging community.
Figures
References
-
- O'Connor JP, Jackson A, Parker GJ, Roberts C, Jayson GC. Dynamic contrast-enhanced MRI in clinical trials of antivascular therapies. Nat Rev Clin Oncol. 2012;9:167–177. - PubMed
Grants and funding
- U01 CA142565/CA/NCI NIH HHS/United States
- R01 CA136892/CA/NCI NIH HHS/United States
- U54 EB005149/EB/NIBIB NIH HHS/United States
- U01 CA140204/CA/NCI NIH HHS/United States
- U01 CA148131/CA/NCI NIH HHS/United States
- U01 CA151261/CA/NCI NIH HHS/United States
- U01 CA140230/CA/NCI NIH HHS/United States
- U01 CA151235/CA/NCI NIH HHS/United States
- U01 CA154601/CA/NCI NIH HHS/United States
- U01 CA142555/CA/NCI NIH HHS/United States
- P01 CA085878/CA/NCI NIH HHS/United States
- S10 OD012240/OD/NIH HHS/United States
- U01 CA166104/CA/NCI NIH HHS/United States
- U01 CA172320/CA/NCI NIH HHS/United States
- U01 CA154602/CA/NCI NIH HHS/United States
LinkOut - more resources
Full Text Sources
Other Literature Sources