

Task-modulated coactivation of vergence neural substrates
- PMID: 24773099
- PMCID: PMC4202927
- DOI: 10.1089/brain.2013.0216
Task-modulated coactivation of vergence neural substrates
Abstract
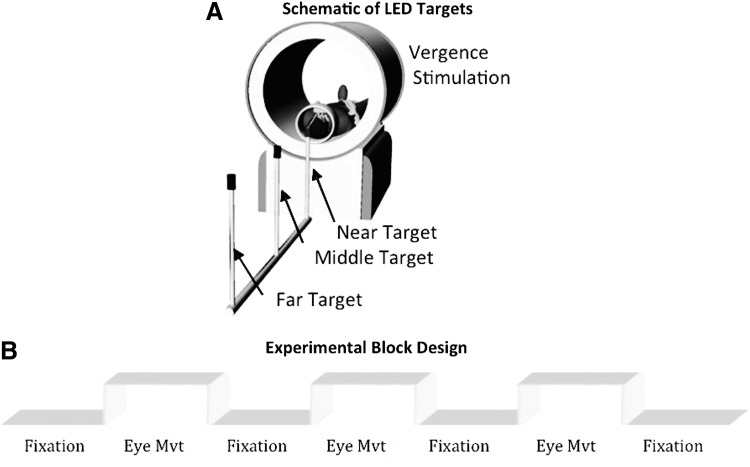
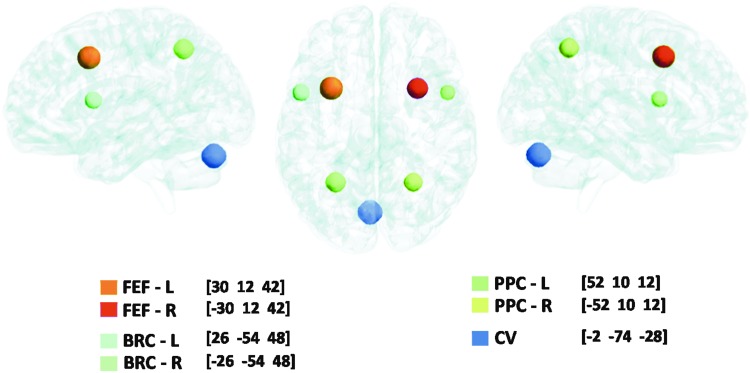
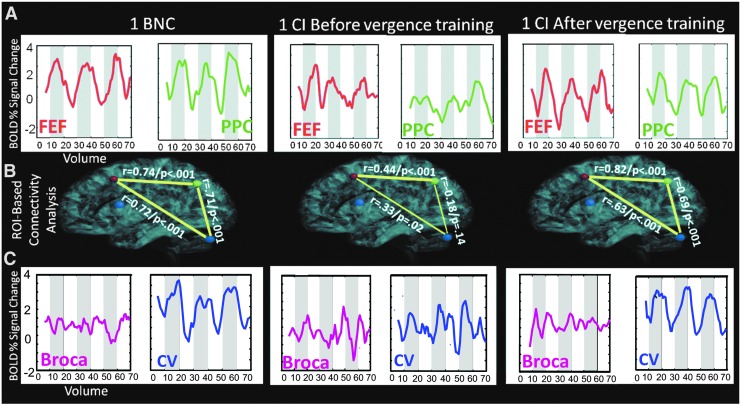
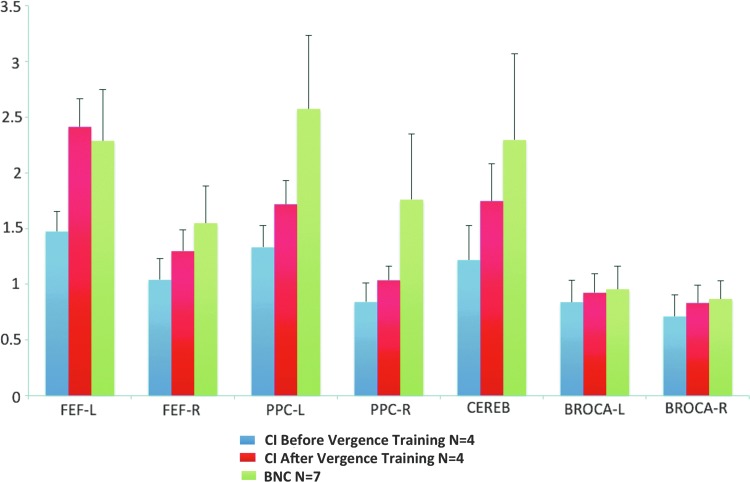
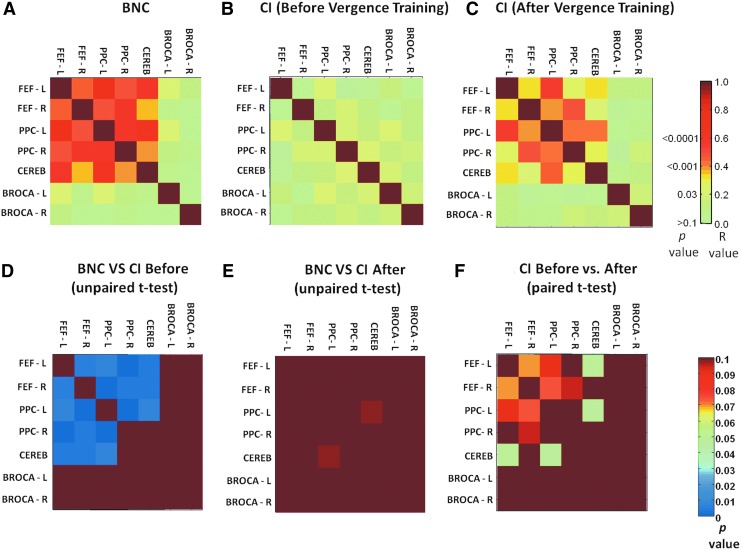
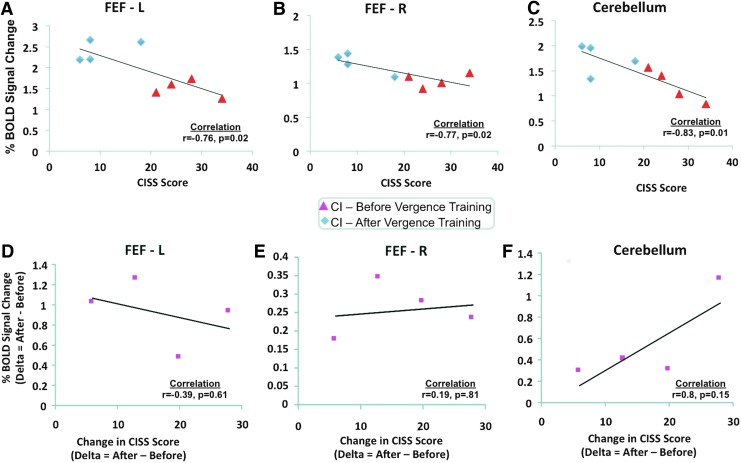
While functional magnetic resonance imaging (fMRI) has identified which regions of interests (ROIs) are functionally active during a vergence movement (inward or outward eye rotation), task-modulated coactivation between ROIs is less understood. This study tested the following hypotheses: (1) significant task-modulated coactivation would be observed between the frontal eye fields (FEFs), the posterior parietal cortex (PPC), and the cerebellar vermis (CV); (2) significantly more functional activity and task-modulated coactivation would be observed in binocularly normal controls (BNCs) compared with convergence insufficiency (CI) subjects; and (3) after vergence training, the functional activity and task-modulated coactivation would increase in CIs compared with their baseline measurements. A block design of sustained fixation versus vergence eye movements stimulated activity in the FEFs, PPC, and CV. fMRI data from four CI subjects before and after vergence training were compared with seven BNCs. Functional activity was assessed using the blood oxygenation level dependent (BOLD) percent signal change. Task-modulated coactivation was assessed using an ROI-based task-modulated coactivation analysis that revealed significant correlation between the FEF, PPC, and CV ROIs. Prior to vergence training, the CIs had a reduced BOLD percent signal change compared with BNCs for the CV (p<0.05), FEFs, and PPC (p<0.01). The BOLD percent signal change increased within the CV, FEF, and PPC ROIs (p<0.001) as did the task-modulated coactivation between the FEFs and CV as well as the PPC and CV (p<0.05) when comparing the CI pre- and post-training datasets. Results from the Convergence Insufficiency Symptom Survey were correlated to the percent BOLD signal change from the FEFs and CV (p<0.05).
Keywords: Convergence Insufficiency Symptom Survey; cerebellar vermis; convergence insufficiency; frontal eye fields; posterior parietal cortex; task-modulated coactivation; vergence.
Figures
Similar articles
-
Functional activity within the frontal eye fields, posterior parietal cortex, and cerebellar vermis significantly correlates to symmetrical vergence peak velocity: an ROI-based, fMRI study of vergence training.Front Integr Neurosci. 2014 Jun 17;8:50. doi: 10.3389/fnint.2014.00050. eCollection 2014. Front Integr Neurosci. 2014. PMID: 24987340 Free PMC article.
-
Test-Retest Reliability of Functional Magnetic Resonance Imaging Activation for a Vergence Eye Movement Task.Neurosci Bull. 2020 May;36(5):506-518. doi: 10.1007/s12264-019-00455-9. Epub 2019 Dec 23. Neurosci Bull. 2020. PMID: 31872328 Free PMC article.
-
Differentiation between vergence and saccadic functional activity within the human frontal eye fields and midbrain revealed through fMRI.PLoS One. 2011;6(11):e25866. doi: 10.1371/journal.pone.0025866. Epub 2011 Nov 2. PLoS One. 2011. PMID: 22073141 Free PMC article.
-
Disorders of vergence eye movements.Curr Opin Neurol. 2011 Feb;24(1):32-7. doi: 10.1097/WCO.0b013e328341eebd. Curr Opin Neurol. 2011. PMID: 21150598 Review.
-
Neural mechanisms underlying target selection with saccadic eye movements.Prog Brain Res. 2005;149:157-71. doi: 10.1016/S0079-6123(05)49012-3. Prog Brain Res. 2005. PMID: 16226583 Review.
Cited by
-
A pilot study of disparity vergence and near dissociated phoria in convergence insufficiency patients before vs. after vergence therapy.Front Hum Neurosci. 2015 Jul 27;9:419. doi: 10.3389/fnhum.2015.00419. eCollection 2015. Front Hum Neurosci. 2015. PMID: 26283944 Free PMC article.
-
Functional magnetic resonance imaging activation for different vergence eye movement subtypes.Ophthalmic Physiol Opt. 2023 Jan;43(1):93-104. doi: 10.1111/opo.13063. Epub 2022 Oct 26. Ophthalmic Physiol Opt. 2023. PMID: 36286324 Free PMC article.
-
Underlying neurological mechanisms associated with symptomatic convergence insufficiency.Sci Rep. 2021 Mar 22;11(1):6545. doi: 10.1038/s41598-021-86171-9. Sci Rep. 2021. PMID: 33753864 Free PMC article.
-
Reliability of Frontal Eye Fields Activation and Very Low-Frequency Oscillations Observed during Vergence Eye Movements: an fNIRS Study.Sci Rep. 2020 Jan 20;10(1):712. doi: 10.1038/s41598-020-57597-4. Sci Rep. 2020. PMID: 31959829 Free PMC article.
-
Test-retest of a phoria adaptation stimulus-induced functional MRI experiment.J Vis. 2020 Aug 3;20(8):17. doi: 10.1167/jov.20.8.17. J Vis. 2020. PMID: 32797193 Free PMC article.
References
-
- Akao T, Kurkin SA, Fukushima J, Fukushima K. 2005. Visual and vergence eye movement-related responses of pursuit neurons in the caudal frontal eye fields to motion-in-depth stimuli. Exp Brain Res 164:92–108 - PubMed
-
- Alkan Y, Biswal BB, Taylor PA, Alvarez TL. 2011b. Segregation of frontoparietal and cerebellar components within saccade and vergence networks using hierarchical independent component analysis of fMRI. Vis Neurosci 28:247–261 - PubMed
-
- Alvarez TL, Alkan Y, Gohel S, Douglas Ward B, Biswal BB. 2010a. Functional anatomy of predictive vergence and saccade eye movements in humans: a functional MRI investigation. Vis Res 50:2163–2175 - PubMed
-
- Alvarez TL, Bhavsar M, Semmlow JL, Bergen MT, Pedrono C. 2005. Short-term predictive changes in the dynamics of disparity vergence eye movements. J Vis 5:640–649 - PubMed
Publication types
MeSH terms
Grants and funding
LinkOut - more resources
Full Text Sources
Other Literature Sources
Medical
