

Modulation of fatty acid and bile acid metabolism by peroxisome proliferator-activated receptor α protects against alcoholic liver disease
- PMID: 24773203
- PMCID: PMC4047177
- DOI: 10.1111/acer.12424
Modulation of fatty acid and bile acid metabolism by peroxisome proliferator-activated receptor α protects against alcoholic liver disease
Abstract
Background: Chronic alcohol intake affects liver function and causes hepatic pathological changes. It has been shown that peroxisome proliferator-activated receptor α (PPARα)-null mice developed more pronounced hepatic changes than wild-type (WT) mice after chronic exposure to a diet containing 4% alcohol. The remarkable similarity between the histopathology of alcoholic liver disease (ALD) in Ppara-null model and in humans, and the fact that PPARα expression and activity in human liver are less than one-tenth of those in WT mouse liver make Ppara-null a good system to investigate ALD.
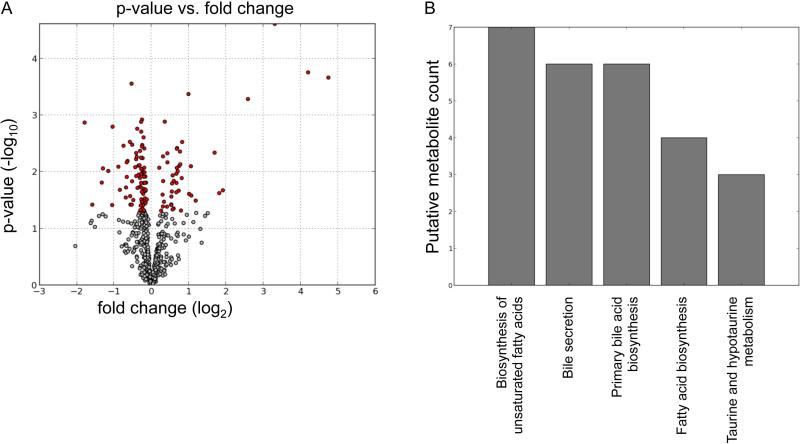
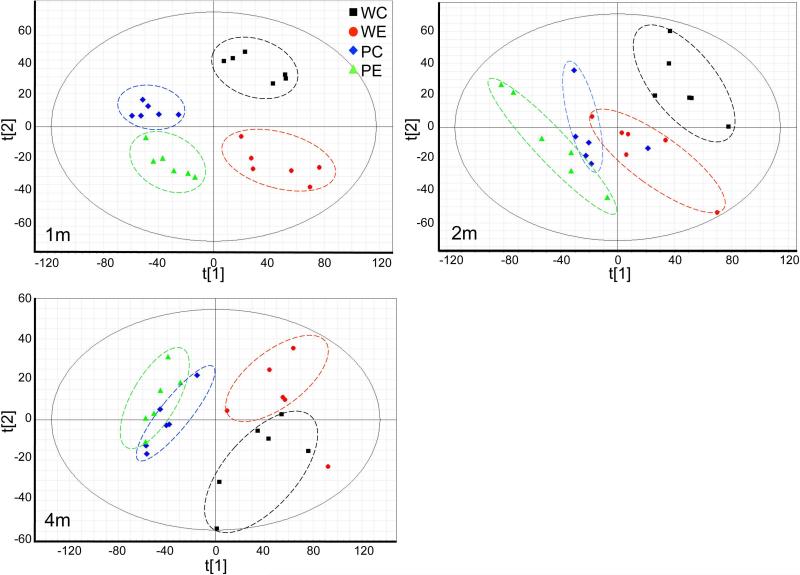
Methods: In this study, the Ppara-null model was used to elucidate the dynamic regulation of PPARα activity during chronic alcohol intake. Hepatic transcriptomic and metabolomic analyses were used to examine alterations of gene expression and metabolites associated with pathological changes. The changes triggered by alcohol consumption on gene expression and metabolites in Ppara-null mice were compared with those in WT mice.
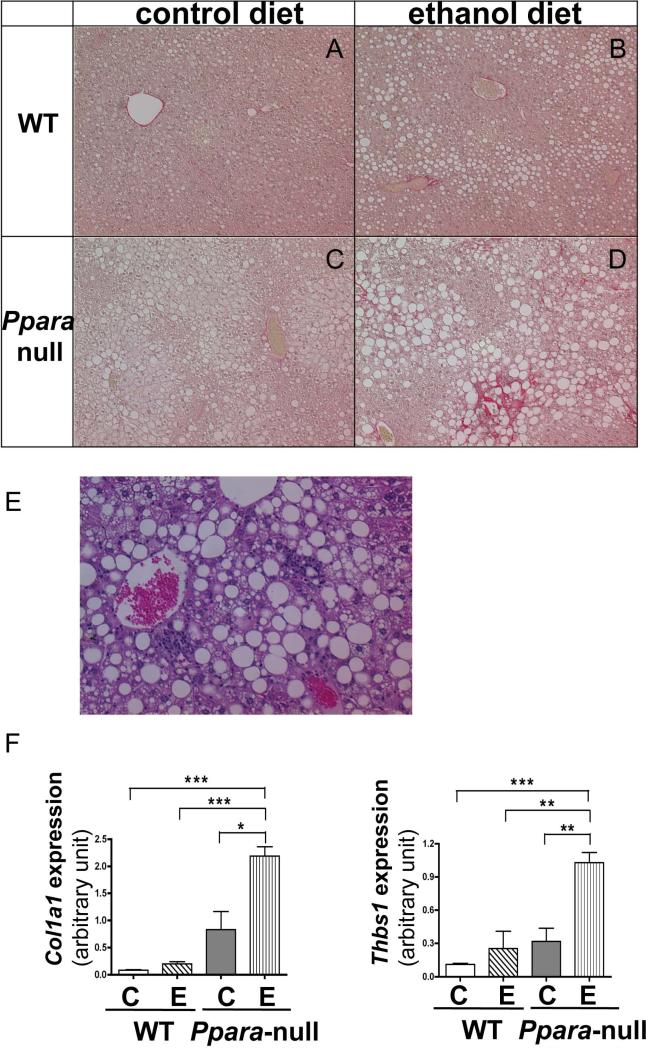
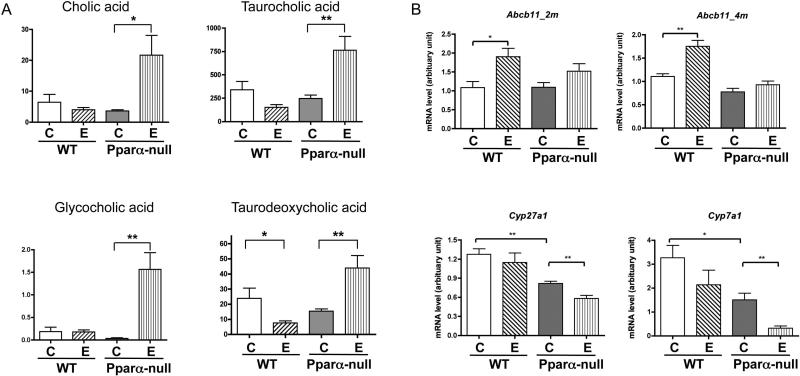
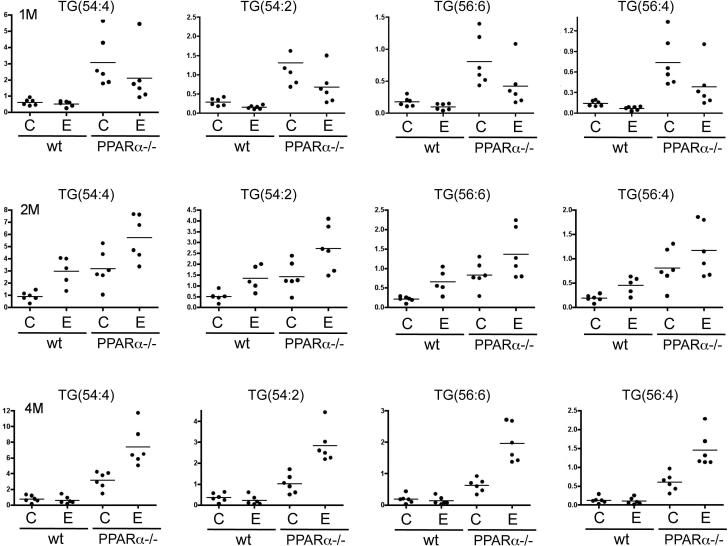
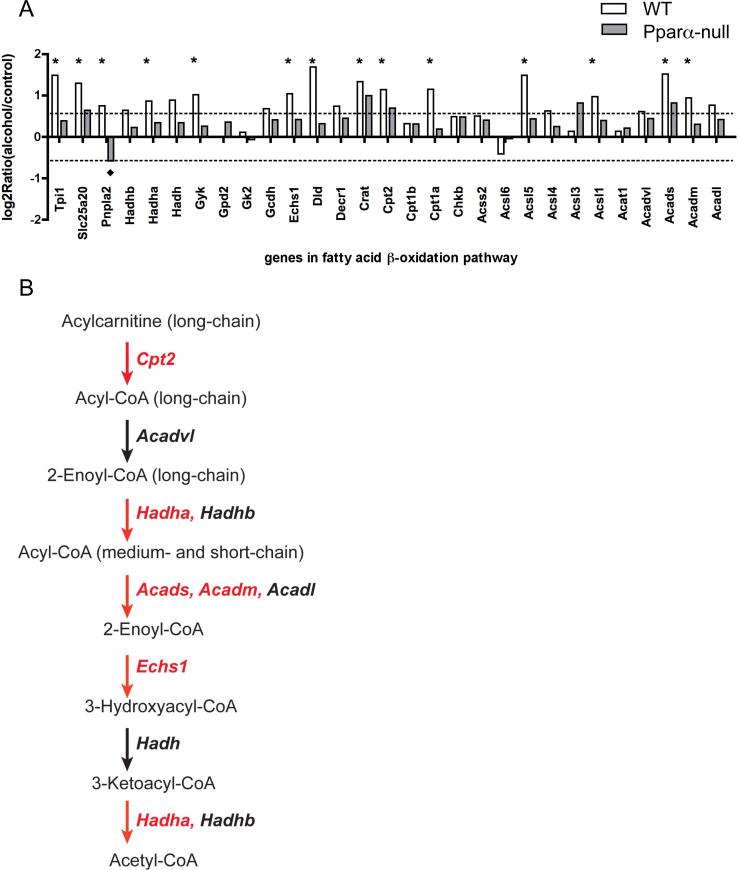
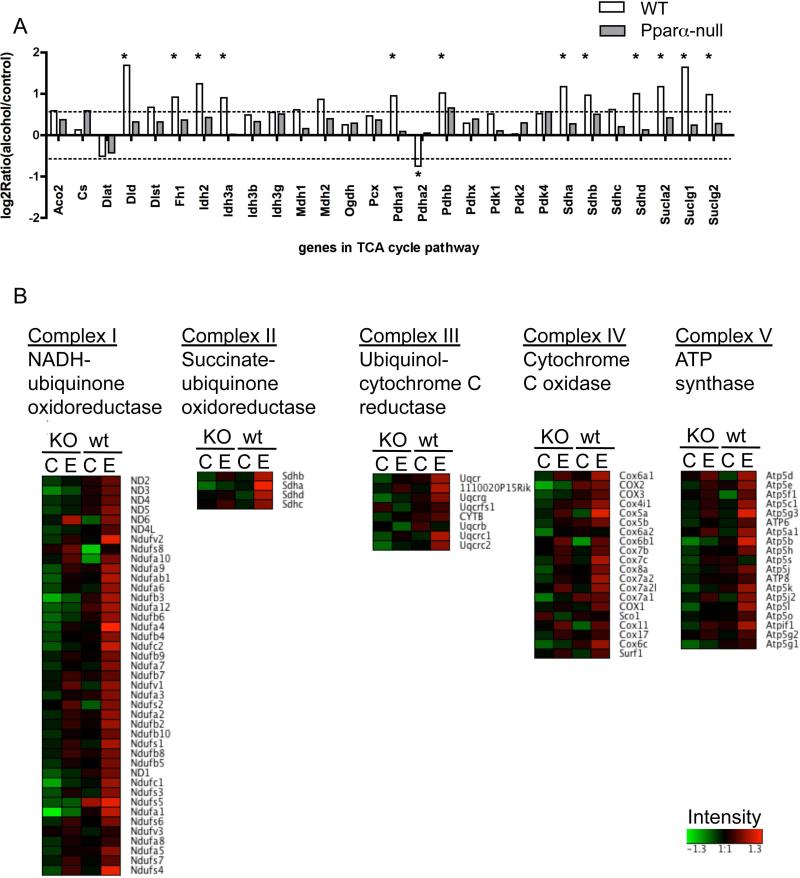
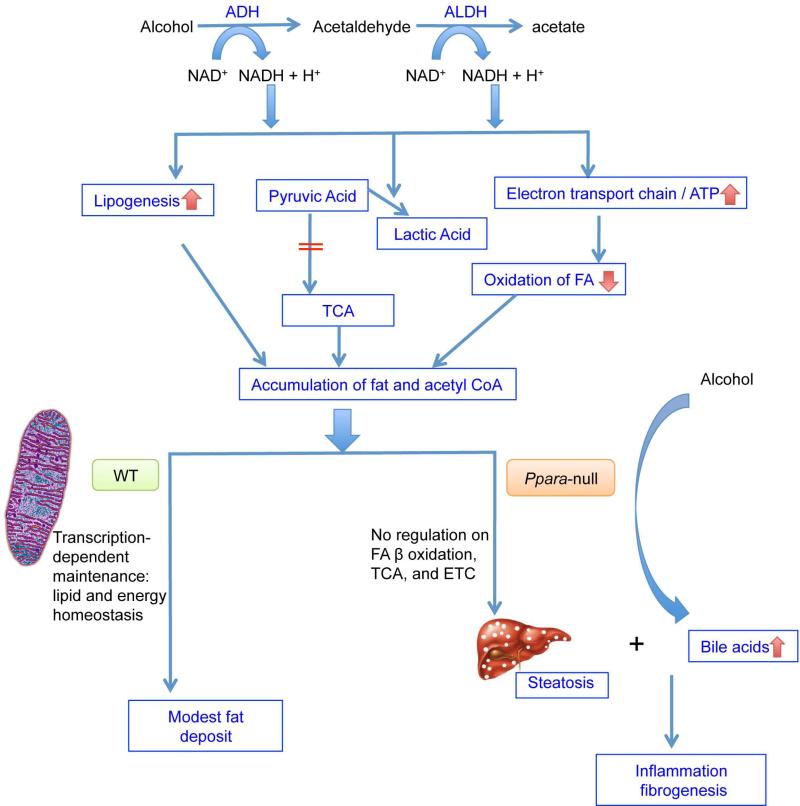
Results: The results showed that in the presence of PPARα, 3 major metabolic pathways in mitochondria, namely the fatty acid β-oxidation, the tricarboxylic acid cycle, and the electron transfer chain, were induced in response to a 2-month alcohol feeding, while these responses were greatly reduced in the absence of PPARα. In line with the transcriptional modulations of these metabolic pathways, a progressive accumulation of triglycerides, a robust increase in hepatic cholic acid and its derivatives, and a strong induction of fibrogenesis genes were observed exclusively in alcohol-fed Ppara-null mice.
Conclusions: These observations indicate that PPARα plays a protective role to enhance mitochondrial function in response to chronic alcohol consumption by adaptive transcriptional activation and suggest that activation of this nuclear receptor may be of therapeutic value in the treatment for ALD.
Keywords: Fibrogenesis; Metabolic Pathways; Metabolomics; Ppara-Null Mice; Transcriptomics.
Copyright © 2014 by the Research Society on Alcoholism.
Figures
Similar articles
-
Metabolomics Reveals Gut Microbiota Contribute to PPARα Deficiency-Induced Alcoholic Liver Injury.J Proteome Res. 2023 Jul 7;22(7):2327-2338. doi: 10.1021/acs.jproteome.3c00093. Epub 2023 May 26. J Proteome Res. 2023. PMID: 37232578
-
Hepatocyte peroxisome proliferator-activated receptor α regulates bile acid synthesis and transport.Biochim Biophys Acta Mol Cell Biol Lipids. 2019 Oct;1864(10):1396-1411. doi: 10.1016/j.bbalip.2019.05.014. Epub 2019 Jun 10. Biochim Biophys Acta Mol Cell Biol Lipids. 2019. PMID: 31195146 Free PMC article.
-
Metabolomics reveals an essential role for peroxisome proliferator-activated receptor α in bile acid homeostasis.J Lipid Res. 2012 Aug;53(8):1625-35. doi: 10.1194/jlr.M027433. Epub 2012 Jun 4. J Lipid Res. 2012. PMID: 22665165 Free PMC article.
-
The role and regulation of the peroxisome proliferator activated receptor alpha in human liver.Biochimie. 2017 May;136:75-84. doi: 10.1016/j.biochi.2016.12.019. Epub 2017 Jan 8. Biochimie. 2017. PMID: 28077274 Review.
-
Molecular mechanisms of alcoholic fatty liver: role of peroxisome proliferator-activated receptor alpha.Alcohol. 2004 Aug;34(1):35-8. doi: 10.1016/j.alcohol.2004.07.005. Alcohol. 2004. PMID: 15670663 Review.
Cited by
-
Metabolomic alterations associated with Behçet's disease.Arthritis Res Ther. 2018 Sep 24;20(1):214. doi: 10.1186/s13075-018-1712-y. Arthritis Res Ther. 2018. PMID: 30249301 Free PMC article.
-
Gypenosides Protect Orbital Fibroblasts in Graves Ophthalmopathy via Anti-Inflammation and Anti-Fibrosis Effects.Invest Ophthalmol Vis Sci. 2020 May 11;61(5):64. doi: 10.1167/iovs.61.5.64. Invest Ophthalmol Vis Sci. 2020. PMID: 32462203 Free PMC article.
-
Lipidomic Signatures of Nonhuman Primates with Radiation-Induced Hematopoietic Syndrome.Sci Rep. 2017 Aug 29;7(1):9777. doi: 10.1038/s41598-017-10299-w. Sci Rep. 2017. PMID: 28852188 Free PMC article.
-
System Biology Investigation Revealed Lipopolysaccharide and Alcohol-Induced Hepatocellular Carcinoma Resembled Hepatitis B Virus Immunobiology and Pathogenesis.Int J Mol Sci. 2023 Jul 6;24(13):11146. doi: 10.3390/ijms241311146. Int J Mol Sci. 2023. PMID: 37446321 Free PMC article.
-
Alcohol's Impact on the Gut and Liver.Nutrients. 2021 Sep 11;13(9):3170. doi: 10.3390/nu13093170. Nutrients. 2021. PMID: 34579046 Free PMC article. Review.
References
-
- Aranha MM, Cortez-Pinto H, Costa A, da Silva IB, Camilo ME, de Moura MC, Rodrigues CM. Bile acid levels are increased in the liver of patients with steatohepatitis. Eur J Gastroenterol Hepatol. 2008;20:519–525. - PubMed
-
- Breitkopf K, Haas S, Wiercinska E, Singer MV, Dooley S. Anti-TGF-beta strategies for the treatment of chronic liver disease. Alcohol Clin Exp Res. 2005a;29:121S–131S. - PubMed
Publication types
MeSH terms
Substances
Associated data
- Actions
Grants and funding
LinkOut - more resources
Full Text Sources
Other Literature Sources
Molecular Biology Databases
