. 2014 May 20;53(19):3095-105.
doi: 10.1021/bi500131a. Epub 2014 May 7.

The C-terminal threonine of Aβ43 nucleates toxic aggregation via structural and dynamical changes in monomers and protofibrils

Affiliations

The C-terminal threonine of Aβ43 nucleates toxic aggregation via structural and dynamical changes in monomers and protofibrils

Alexander E Conicella et al. Biochemistry. .

Abstract

Recent studies suggest that deposition of amyloid β (Aβ) into oligomeric aggregates and fibrils, hallmarks of Alzheimer's disease, may be initiated by the aggregation of Aβ species other than the well-studied 40- and 42-residue forms, Aβ40 and Aβ42, respectively. Here we report on key structural, dynamic, and aggregation kinetic parameters of Aβ43, extended by a single threonine at the C-terminus relative to Aβ42. Using aggregation time course experiments, electron microscopy, and a combination of nuclear magnetic resonance measurements including backbone relaxation, dark-state exchange saturation transfer, and quantification of chemical shift differences and scalar coupling constants, we demonstrate that the C-terminal threonine in Aβ43 increases the rate and extent of protofibril aggregation and confers slow C-terminal motions in the monomeric and protofibril-bound forms of Aβ43. Relative to the neighboring residues, the hydrophilic Thr43 of Aβ43 favors direct contact with the protofibril surface more so than the C-terminus of Aβ40 or Aβ42. Taken together, these results demonstrate the potential of a small chemical modification to affect the properties of Aβ structure and aggregation, providing a mechanism for the potential role of Aβ43 as a primary nucleator of Aβ aggregates in Alzheimer's disease.


Figures
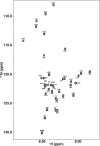
Figure 1
Figure 1
Backbone amide region of 1H–15N heteronuclear single-quantum coherence (HSQC) spectrum of 25 μM Aβ43.
Figure 2
Figure 2
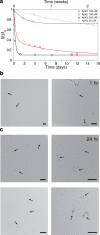
Aβ43 aggregates into protofibrillar species in a concentration-dependent and time-dependent manner. (a) The ratio of monomeric NMR signal intensity [I(t)/I0] decays exponentially as a function of time. Aβ43 at concentrations of 25 μM (gray) and 120 μM (black) was monitored via HSQC cross peak intensities for over 2 weeks. The significantly slower aggregation of similar concentrations of Aβ42 (160 μM, red) and Aβ40 (150 μM, blue) under identical conditions is shown for comparison (data for Aβ40 and Aβ42 from ref (26)). Transmission electron microscopy images of 120 μM Aβ43 showing that (b) protofibrils are visible as little as 1 h after sample preparation and (c) protofibrils are present at a higher concentration after 24 h. Arrows highlight some of the protofibrils present, although many more are evident within each image. Scale bars represent 200 nm.
Figure 3
Figure 3
Diagram of the NMR experiments conducted, the phenomena probed by these experiments, and a summary of the results.
Figure 4
Figure 4
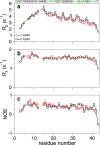
Dynamics of the backbone of monomeric Aβ42 and Aβ43 as measured by (a) 15N R2, (b) 15N R1, and (c) heteronuclear 15N–{1H} nuclear Overhauser effect (hetNOE) values. Dynamical differences on the picosecond to nanosecond time scale are observed for the central (R2) and C-terminal regions (R2, R1, and hetNOE) of Aβ43. Error bars denote one standard deviation. Hydrophobic residues appear in green.
Figure 5
Figure 5
Chemical shift differences between monomeric Aβ42 and Aβ43 span from residue 31 to the C-terminus. Differences in (a) proton, 1HN Δδ, and (b) nitrogen, 15N Δδ, chemical shifts between Aβ43 and Aβ42. Large changes in chemical shifts for residue A42 in Aβ42 and Aβ43 due to terminal effects are not shown.
Figure 6
Figure 6
3JHN-Hα couplings for residues A30 through the C-terminus of Aβ40 (blue), Aβ42 (red), and Aβ43 (black). Error bars denote the standard deviation.
Figure 7
Figure 7
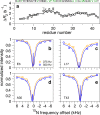
Protofibril-bound state of Aβ43 probed at atomic resolution by 15N ΔR2 and dark-state exchange saturation transfer (DEST) NMR spectroscopy. (a) The enhancements in 15N transverse relaxation rates [15N ΔR2 (○)] of 120 μM Aβ43 compared to those of 25 μM samples arise due to interactions of the NMR visible monomeric peptide with the protofibrils. The best-fit 15N ΔR2 is illustrated with the solid black line. (b–e) 15N DEST experiments. The normalized intensity of Aβ43 monomer resonances as a function of saturation at kilohertz offsets from the 15N carrier frequency (119 ppm). Radiofrequency fields of 500 and 375 Hz at frequency offsets from 6 to −6 kHz were used to saturate the protofibrillar dark state with single-residue specificity, shown for residues E3, L17, A30, and T43. Lines indicate the calculated saturation profiles using the best-fit parameters for a 15N spin in a model incorporating both tethered and direct contact states. Error bars denote the standard deviation.
Figure 8
Figure 8
Binding model and local parameters describing Aβ43 monomer–protofibril interactions. (a) The dynamic binding of Aβ43 to protofibrils can be described by a model incorporating two different ensembles of states for each residue: in direct contact with the surface or tethered via the binding of other residues. (b) Residue-specific equilibrium constant (K3) values for Aβ40 (blue), Aβ42 (red), and Aβ43 (black) describing the relative ratio of direct contact and tethered states for each residue. (c) Residue-specific 15N R2tethered values for Aβ40 (blue), Aβ42 (red), and Aβ43 (black) describing the average structure and motions of each residue when it is tethered to protofibrils by the binding of other residues in the same chain. Error bars denote the standard deviation. Values presented for Aβ40 and Aβ42 were taken from ref (26).

References

    1. Hardy J.; Selkoe D. J. (2002) The amyloid hypothesis of Alzheimer’s disease: Progress and problems on the road to therapeutics. Science 297, 353–356. - PubMed
    1. Dickson D. W.; Crystal H. A.; Bevona C.; Honer W.; Vincent I.; Davies P. (1995) Correlations of synaptic and pathological markers with cognition of the elderly. Neurobiol. Aging 16, 285–298, 298–304 (discussion). - PubMed
    1. McLean C. A.; Cherny R. A.; Fraser F. W.; Fuller S. J.; Smith M. J.; Beyreuther K.; Bush A. I.; Masters C. L. (1999) Soluble pool of Aβ amyloid as a determinant of severity of neurodegeneration in Alzheimer’s disease. Ann. Neurol. 46, 860–866. - PubMed
    1. Walsh D. M.; Hartley D. M.; Kusumoto Y.; Fezoui Y.; Condron M. M.; Lomakin A.; Benedek G. B.; Selkoe D. J.; Teplow D. B. (1999) Amyloid β-protein fibrillogenesis. Structure and biological activity of protofibrillar intermediates. J. Biol. Chem. 274, 25945–25952. - PubMed
    1. Lue L. F.; Kuo Y. M.; Roher A. E.; Brachova L.; Shen Y.; Sue L.; Beach T.; Kurth J. H.; Rydel R. E.; Rogers J. (1999) Soluble amyloid β peptide concentration as a predictor of synaptic change in Alzheimer’s disease. Am. J. Pathol. 155, 853–862. - PMC - PubMed

Publication types

MeSH terms

LinkOut - more resources