. 2014 May 8;509(7499):189-94.
doi: 10.1038/nature13161. Epub 2014 Apr 28.

Astrocyte-encoded positional cues maintain sensorimotor circuit integrity

Affiliations

Astrocyte-encoded positional cues maintain sensorimotor circuit integrity

Anna V Molofsky et al. Nature. .

Abstract

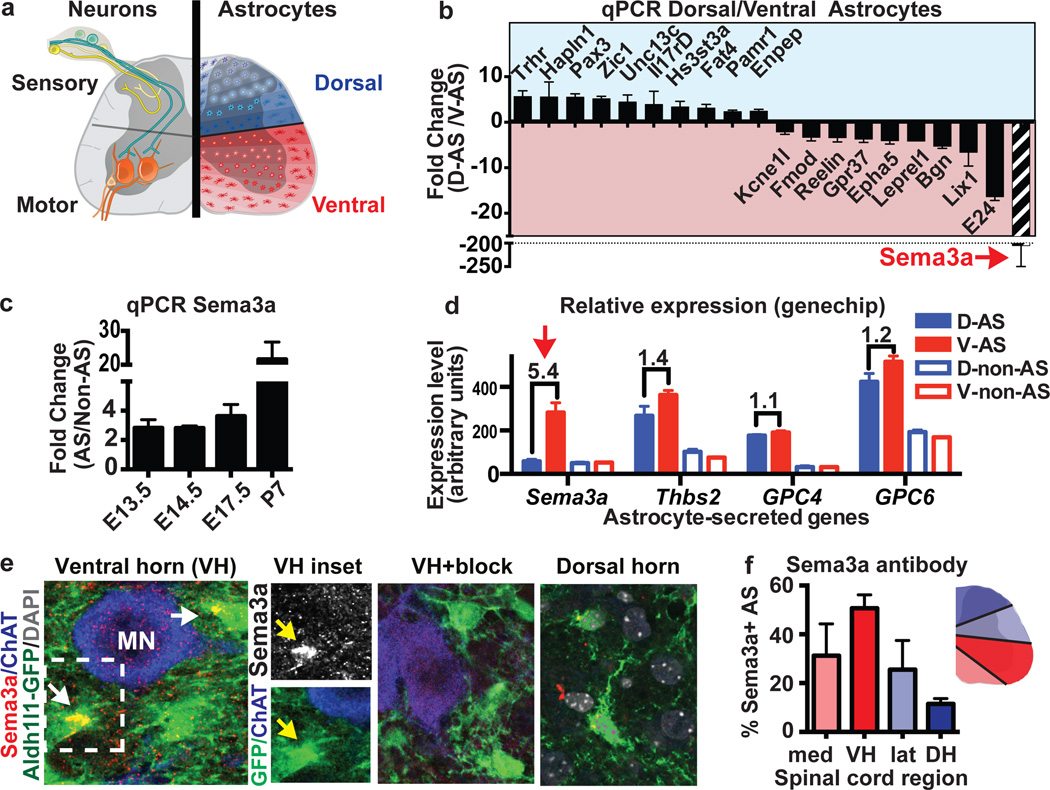
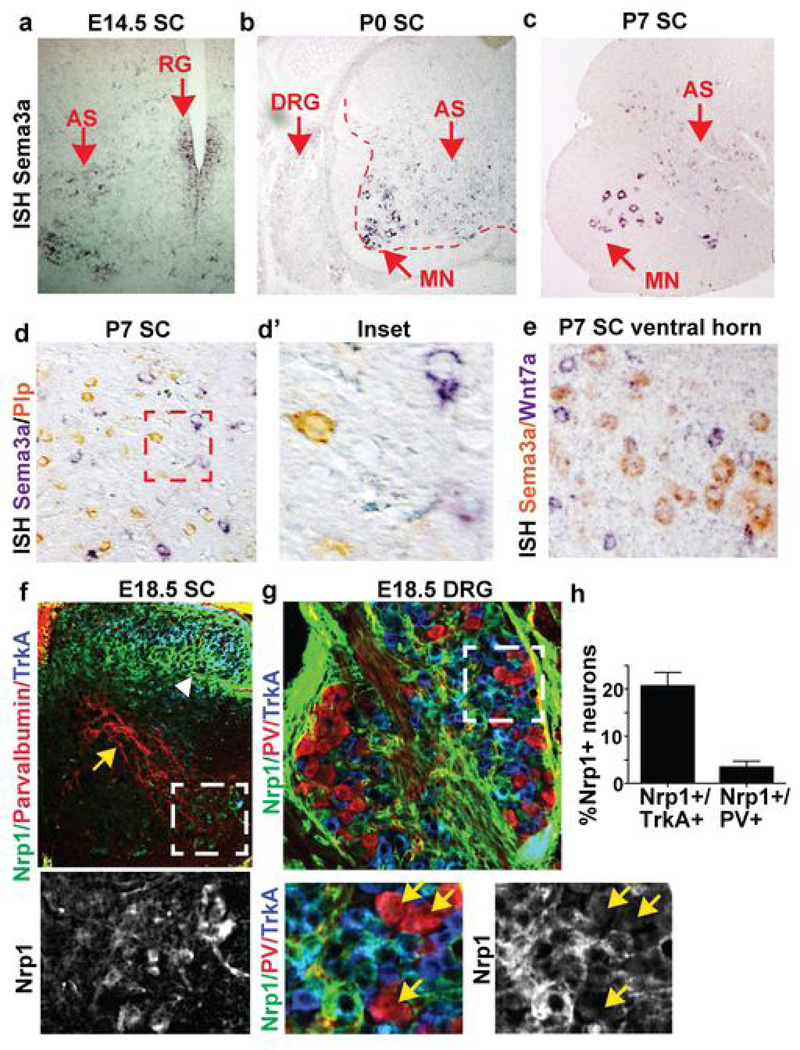
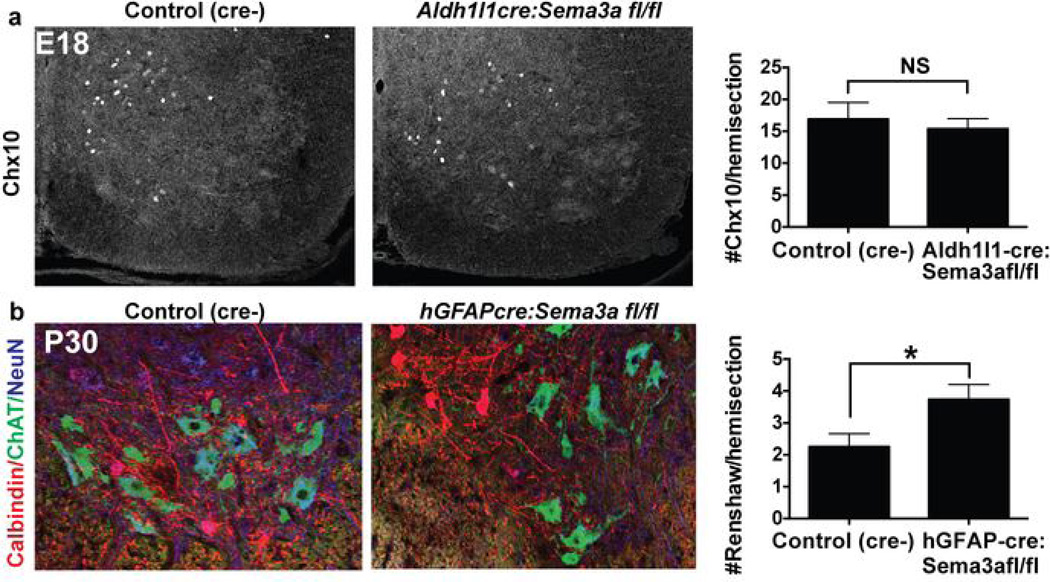
Astrocytes, the most abundant cells in the central nervous system, promote synapse formation and help to refine neural connectivity. Although they are allocated to spatially distinct regional domains during development, it is unknown whether region-restricted astrocytes are functionally heterogeneous. Here we show that postnatal spinal cord astrocytes express several region-specific genes, and that ventral astrocyte-encoded semaphorin 3a (Sema3a) is required for proper motor neuron and sensory neuron circuit organization. Loss of astrocyte-encoded Sema3a leads to dysregulated α-motor neuron axon initial segment orientation, markedly abnormal synaptic inputs, and selective death of α- but not of adjacent γ-motor neurons. In addition, a subset of TrkA(+) sensory afferents projects to ectopic ventral positions. These findings demonstrate that stable maintenance of a positional cue by developing astrocytes influences multiple aspects of sensorimotor circuit formation. More generally, they suggest that regional astrocyte heterogeneity may help to coordinate postnatal neural circuit refinement.


Figures

Figure 1
Figure 1. AS express region-specific genes
a) Concept of dorsal/ventral AS functional specialization. b) qPCR validation of differentially expressed genes in Aldh1L1-GFP+ dorsal or ventral SC AS (2/4 samples had undetectable dorsal Sema3a). c) qPCR of Aldh1L1-GFP AS versus non-AS (purity >95%). d) Regional expression of Sema3a versus thrombospondin 2 (Thbs2), and glypicans-4/6. e) Sema3a proteins in ventral but not dorsal SC Aldh1L1-GFP+ protoplasmic AS (arrows, inset) (antibody blocking peptide “block”), f) Graded DV expression of Sema3a protein as percent of Sema3a+/Aldh1L1-GFP+ AS at E18.5; VH=ventral horn, DH=dorsal horn. (All data mean ±s.e.m.; β-actin as HK gene in qPCRs; n=4 (b) or 3(c–f) biological replicates/bar).
Figure 2
Figure 2. Axon-repulsive effects of AS-encoded Sema3a maintain α-MN AIS orientation
a) P7 lumbar SC ChAT/NeuN+ α-MNs with AnkG+ AIS. Ventral root (*) and orientation vector towards it for selected α-MN (white arrows). b) Insets of yellow boxed areas in (a). Yellow arrow denotes AnkG+ AIS junction, the angle between these vectors determines AIS orientation. c) Overlay of all lumbar AIS orientation angles demonstrates that misoriented MN are topographically distributed. d) Mean angle and variability is significantly increased in P7 α-MN in absence of AS-encoded Sema3a (0°=towards ventral root). e) No difference in AIS orientation in γ-MN. f) Scatter plot of data generated as in panel (c) shows no misorientation of α- or γ-MN by P30. g) AIS angles in Aldh1L1cre:Sema3afl/fl are normal at E14.5 and significantly misoriented by P0. h) Deletion of Sema3a from MN with Hb9cre does not affect MN AIS orientation at E17.5. i) AS-MN coculture protocol. j,k) Increased MN axon overlap with Ade-cre deletion of AS Sema3afl/fl (white arrowhead: proximal axon). l) Summary. Statistics and error bars: mean±S.D. Watson’s U2 test, except k: mean±s.e.m. student’s t-test. d,e,g) >100 neurons, n=3–4/genotype, except at E14.5 n=2/genotype; f) >40 neurons n=4/genotype; h) >30 neurons n=2/genotype; k >20 neurons/condition; 3 independent experiments. *p<0.05, **p<0.01, ***p<0.001.
Figure 3
Figure 3. AS-encoded Sema3a is required for postnatal α-MN survival
a,b) Normal numbers of α-MN (Chat+/NeuN+) and γ-MN (Chat+/NeuN-) at P7 in hGFAPcre:Sema3afl/fl cervical and lumbar SC. c, d) Fewer large α-MN and preserved numbers of γ-MN (Err3-bright, arrows.) in hGFAPcre:Sema3afl/fl animals at P28-P33. e, f) Dose-dependent decrease in MN soma area at P28–33 with loss of AS-Sema3a; histograms show relative depletion of large MN (arrow). g) Representative Peripherin+/Map2+ embryonic rat MN cultured in factor-free media or with recombinant Sema3a (red arrow: soma). h) MN survival with recombinant Sema3a with/without Nrp1-blocking antibody. i) Summary. Statistics: mean ±s.e.m. (e,f) one-way mixed effects ANOVA with Tukey’s multiple comparison. (b,c,h) student’s t-test. Data in b,c from 4/genotype from 4 sections/animal; h average of 4 independent experiments. *p<0.05, **p<0.01, ***p<0.001.
Figure 4
Figure 4. AS-encoded Sema3a regulates MN synaptogenesis and function
a) Schematic of MN synaptic puncta. b) Decreased sensorimotor excitatory puncta (vGlut1+), increased inhibitory puncta (VGAT+), and preserved vGlut2+ inputs in hGFAPcre:Sema3afl/fl animals. c) Electrophysiology schematic. d,e) Representative action potentials and mean rheobase value demonstrate hyper excitable hGFAPcre:Sema3afl/flMN. f,g) Decreased sEPSC frequency and (h,i) increased sIPSC frequency in hGFAPcre:Sema3afl/fl MN. Statistics: mean ±s.e.m. Data in b from cervical and lumbar levels of >4/genotype and >200 MN/ea; data in d-h =5–6/genotype from lumbar slices. (b) one-way mixed effects ANOVA with Tukey’s comparison; vglut2: student’s t-test. (d–h) student’s t-test. *p<0.05, **p<0.01, ***p<0.001, ****p<0.0001.
Figure 5
Figure 5. AS-encoded Sema3a regulates DV positioning of sensory axons
a) DiI labeling of upper thoracic SC demonstrates ectopic ventral fibers in Aldh1L1cre:Sema3afl/fl mice inset (box, arrows) (n=7/group).b) No ectopic proprioceptive 1a afferents (white arrow) in Aldh1L1cre:Sema3afl/flmice; n=4/group. c) Multiple ectopic ventral TrkA+ projections in Aldh1L1cre:Sema3afl/fl mice (box, insets). d) Overlay dot-plot of TrkA+ terminations in cre-negative controls (black circles) and Aldh1L1cre:Sema3afl/fl (red stars) n≥3/genotype. e) Quantification of DV termination index (DTI) shows a significant increase in ventral terminations in Aldh1L1cre:Sema3afl/fl mice. f) Medial vs. lateral terminations unchanged. g) Summary. h) Culture schematic. i) Representative TrkA+ DRG neuron grown on SC AS. j) Tracings of wild-type DRG neurons grown on dorsal/ventral SC AS from Sema3afl/fl mice, under WT (no virus) or Sema3a−/− (+Ade-cre) conditions. k) Reduced total neurite length of neurons grown on ventral (red) vs dorsal (blue) AS significantly rescued on Sema3a-/- ventral AS. l,m) Sholl analysis shows significantly less branching on ventral AS (l), rescued withSema3a deletion (m). Statistics: Culture data from 4–6 independent experiments with >10 neurons/condition per experiment. Mean+/-s.e.m; * p<0.05, ** p<0.01, ***p<0.001 student’s t-test).
Extended Data Figure 1
Extended Data Figure 1. Flow cytometry gating strategy and microarray
a) Schematic indicating microdissection of Aldh1l1-GFP positive P7 spinal cord and isolation by flow cytometry using scatter gates, doublet exclusion (not shown) and sorting for GFP positive cells with live/dead exclusion by DAPI staining. Percent Aldh1l1-GFP cells not significantly different between dorsal and ventral (not shown.) b) Summary of differentially expressed genes in astrocytes (AS), whole cord, or both using the analysis parameters indicated. c) Heatmap of all 39 genes differentially expressed between dorsal and ventral cord, highlighting astrocyte-enriched genes with known roles in neural circuit development (red) or extracellular matrix (blue.)
Extended Data Figure 2
Extended Data Figure 2. Coordinate expression of Sema3a and Nrp1 in astrocytes and neurons
a-c)Sema3a mRNA is expressed in radial glia (RG) and in protoplasmic cells that are NeuN negative throughout the embryonic and early postnatal period. Sema3a not detected in DRG or in SC white matter (b). d) Sema3a is segregated from Plp-positive oligodendrocytes. e) MN Sema3a expression is detected in α−but not γ-MN in cervical SC. f-g) High levels of Nrp1 expression in TrkA+ fibers and cell bodies (white arrowhead) and in MN, but not in PV positive fibers and cell bodies (yellow arrows;) h) Quantification of percent Nrp1+ neurons/condition.
Extended Data Figure 3
Extended Data Figure 3. Fate map of conditional astrocyte deletion lines used in this study
a)hGFAPcre fate map labels fibrous and a subset of protoplasmic astrocytes but not MN or interneurons in P10 SC. b) Aldh1L1cre fate maps to astrocytes but not to neurons in P10 SC, including α-MN (purple), γ-MN (blue), and interneurons (red.)
Extended Data Figure 4
Extended Data Figure 4. Motor neuron AIS orientation defects in cervical spinal cord
a) Representative images of cervical spinal cord confocal sections stained to distinguish α and γ MN and identify their proximal axon segment (asterisk=ventral root). b) Inset shows high-magnification view of representative MN with identifiable AIS and a schematic of their location with respect to the ventral root. c) Overlay of all cervical a-MN angles measured to generate data summarized in Fig. 2c, with positional information preserved, demonstrates that misoriented AIS can be seen at all dorsoventral positions.
Extended Data Figure 5
Extended Data Figure 5. No evidence of abnormal MN cell body positioning with loss of astrocyte-encoded Sema3a
a) Representative FoxP1/Islet1/2 colabeling at three rostrocaudal levels in control and mutant animals shows no differences between control and mutant. b) Similar stainings using Scip (a PMC and LMC marker.) c-d) No obvious differences in dorsoventral or mediolateral boundaries of ChaT+ MN at comparable cervical or lumbar levels at P0 (using Aldh1L1-cre to delete Sema3a) and P7 (with hGFAPcre), both time periods where misorientation of AIS is clearly evident.
Extended Data Figure 6
Extended Data Figure 6. Quantification of ventral interneuron populations after loss of astrocyte-encoded Sema3a
a) Chx 10 staining at E18 and quantification. b) Calbindin staining of Renshaw interneurons at P30 and quantification demonstrates a significant increase at this age. Statistics: mean±s.e.m., student’s t-test, data in a from n=2 /group, 4 sxns/animal, data in b from 4/group 4 sxns/animal.
Extended Data Figure 7
Extended Data Figure 7. Additional data and controls for MN electrophysiology
(a) 2µM strychnine and 20µM bicuculline block postsynaptic currents (at-55mV) in a ChAT-GFP+ lumbar MN. (b) 20µM 6,7-dinitroquinoxaline-2,3-dione (DNQX) and 50µM (2R)-amino-5-phosphonovaleric acid (AP5) block postsynaptic currents (at −75mV) in a ChAT-GFP+ lumbar MN. (c) No difference in input resistance, sIPSC amplitude, and sEPSC amplitude between control (cre-) and hGFAPcre:Sema3afl/fl (fl/fl) MN. n=5/eA; mean±s.e.m. student’s t-test.
Extended Data Figure 8
Extended Data Figure 8. Normal dorsal root ganglia in Aldh1L1 cre:Sema3afl/fl mice
a) No difference in the number of subtype specific neurons per DRG in control or Aldh1l1cre:Sema3afl/fl mice (n=3 from 4-5 sections per animal; mean±s.e.m.; student’s t-test).
Extended Data Figure 9
Extended Data Figure 9. Differential expression of regionally heterogeneous astrocyte genes is partly preserved in vitro
qPCR quantification demonstrates that many regionally heterogenous microarray genes prospectively identified in vivo remain differentially expressed in vitro after 17 days in culture, including ventral Sema3a. Mean±s.e.m., n=3 independent experiments.

Comment in

References

    1. Clarke LE, Barres BA. Emerging roles of astrocytes in neural circuit development. Nat Rev Neurosci. 2013;14:311–321. - PMC - PubMed
    1. Tsai H-H, et al. Regional astrocyte allocation regulates CNS synaptogenesis and repair. Science. 2012;337:358–362. - PMC - PubMed
    1. Hochstim C, Deneen B, Lukaszewicz A, Zhou Q, Anderson DJ. Identification of Positionally Distinct Astrocyte Subtypes whose Identities Are Specified by a Homeodomain Code. Cell. 2008;133:510–522. - PMC - PubMed
    1. Muroyama Y, Fujiwara Y, Orkin SH, Rowitch DH. Specification of astrocytes by bHLH protein SCL in a restricted region of the neural tube. Nature. 2005;438:360–363. - PubMed
    1. Rowitch DH, Kriegstein AR. Developmental genetics of vertebrate glial-cell specification. Nature. 2010;468:214–222. - PubMed

Publication types

MeSH terms

Associated data