. 2014 Jun 26;510(7506):556-9.
doi: 10.1038/nature13295. Epub 2014 Apr 28.

BRCA1 controls homologous recombination at Tus/Ter-stalled mammalian replication forks

Affiliations

BRCA1 controls homologous recombination at Tus/Ter-stalled mammalian replication forks

Nicholas A Willis et al. Nature. .

Abstract

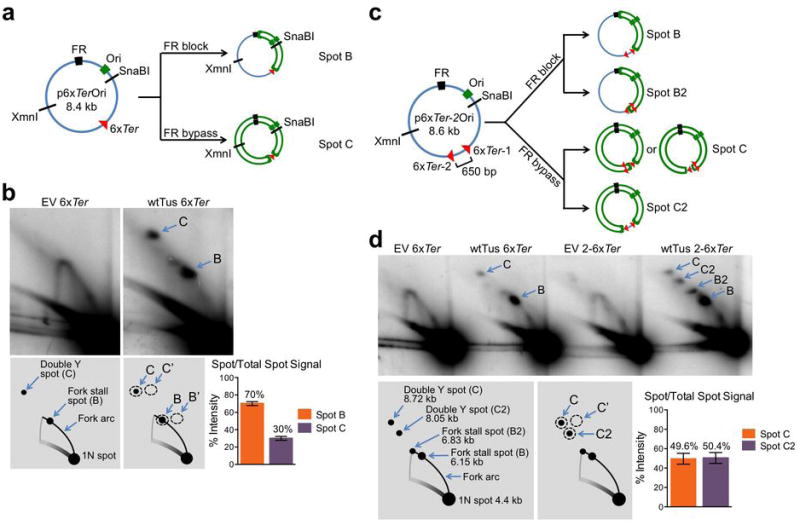
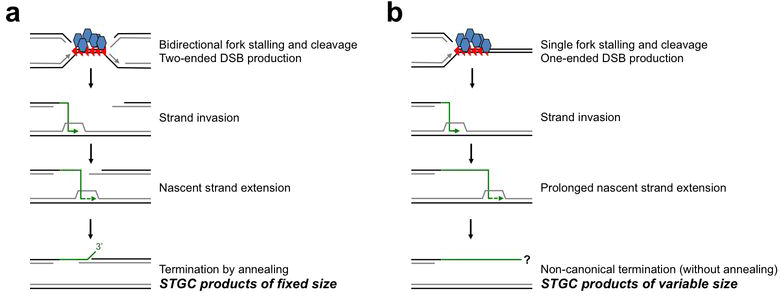
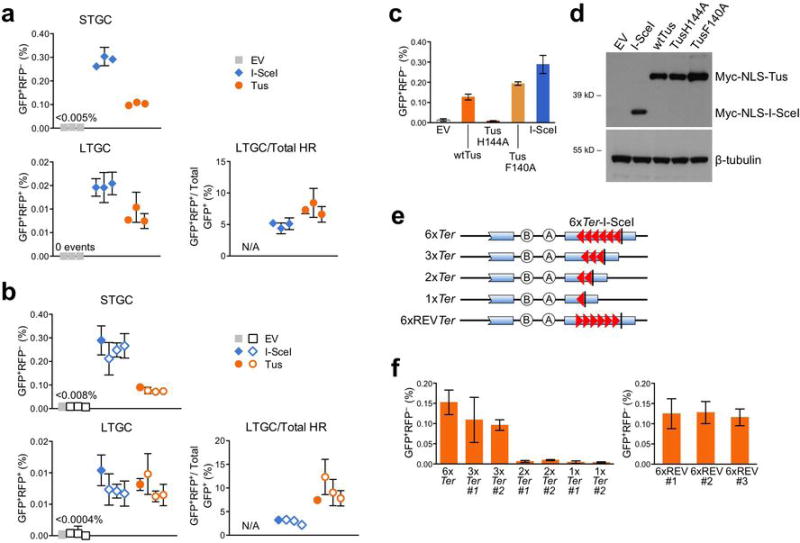
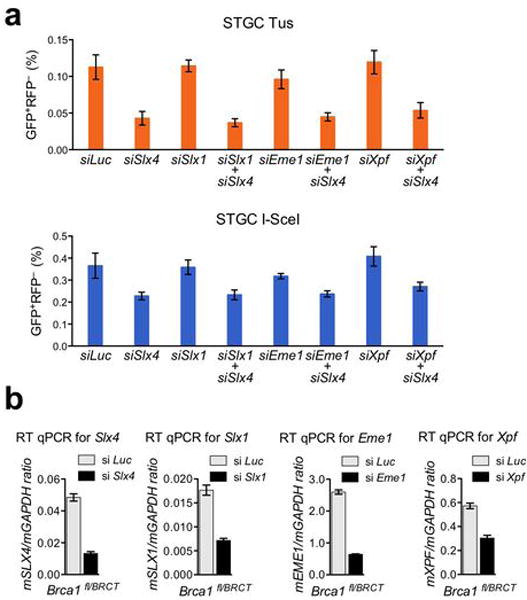
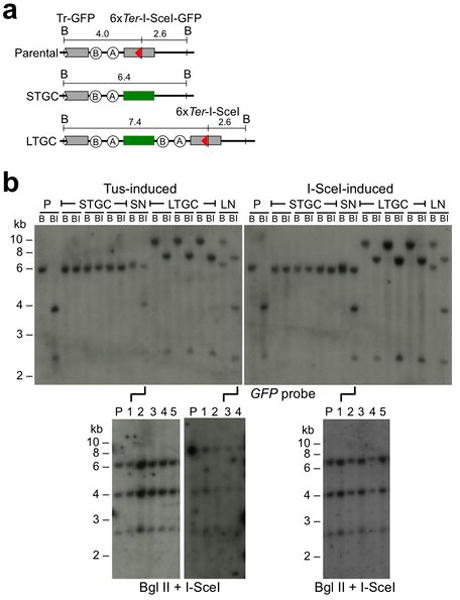
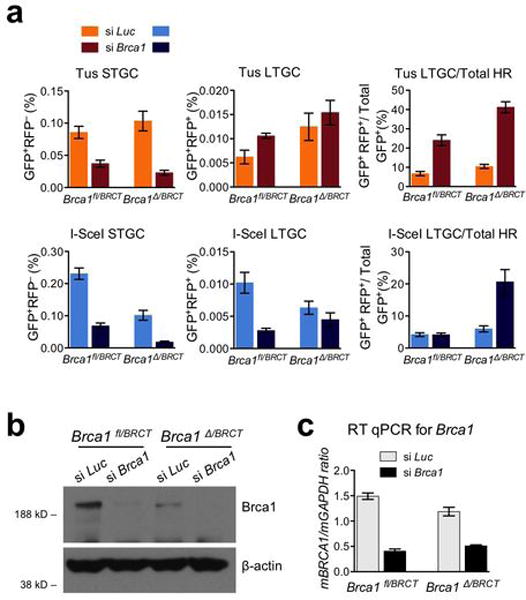
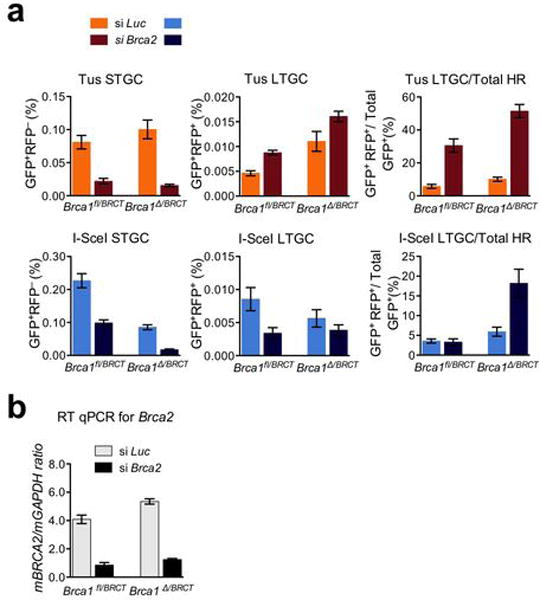
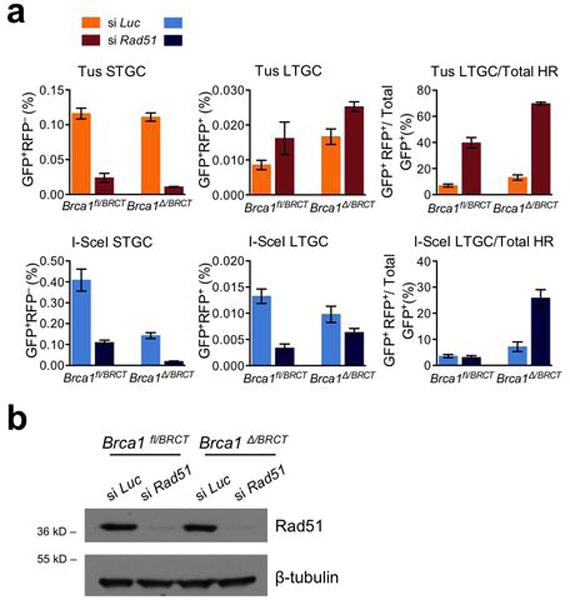
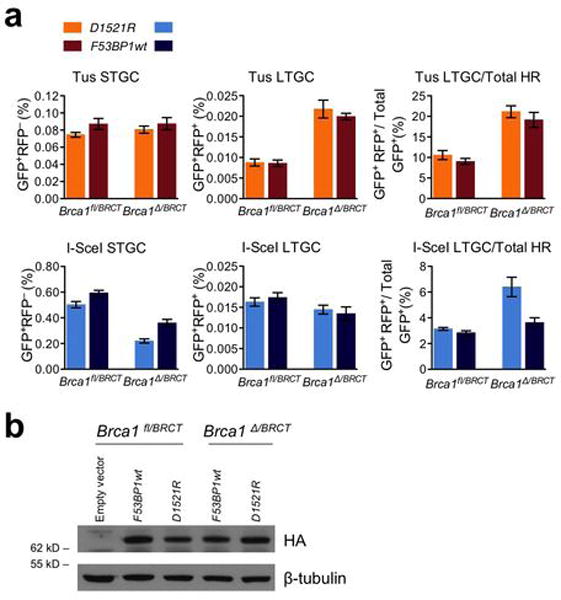
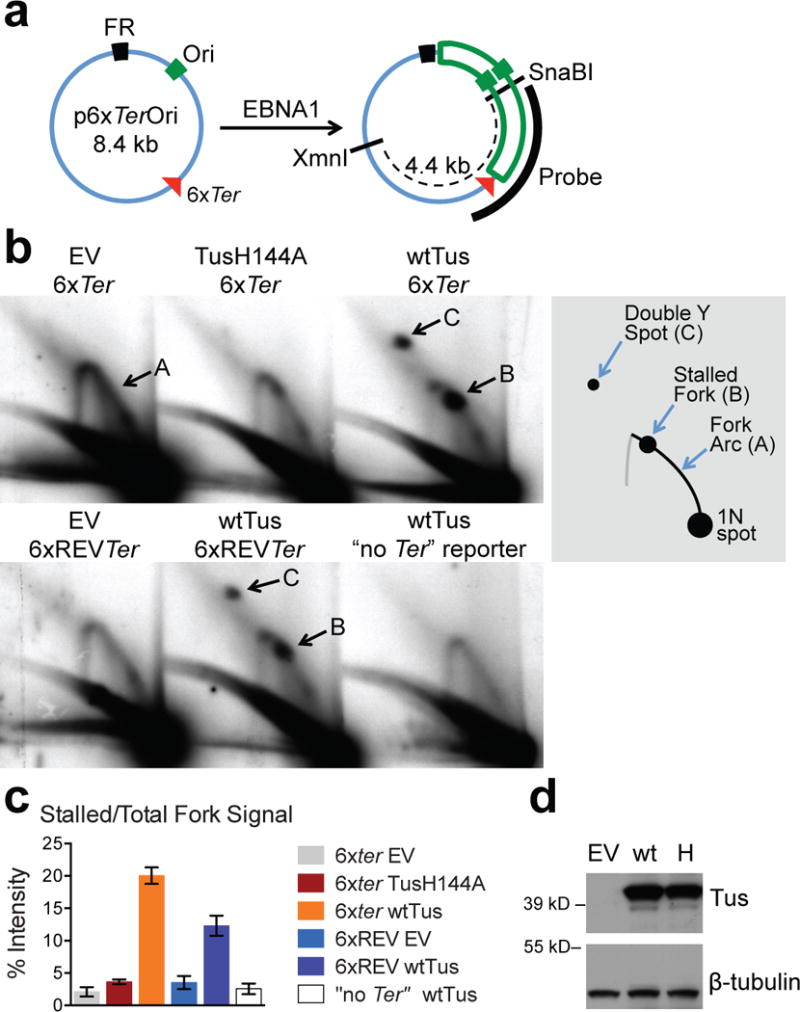
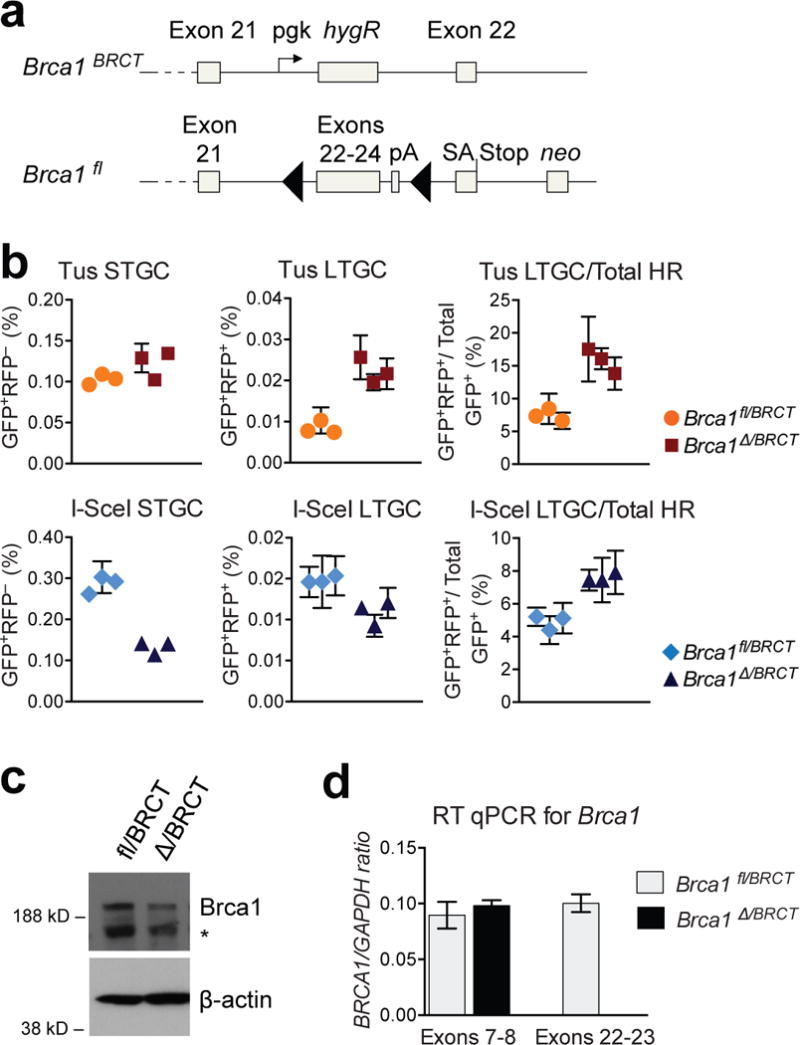
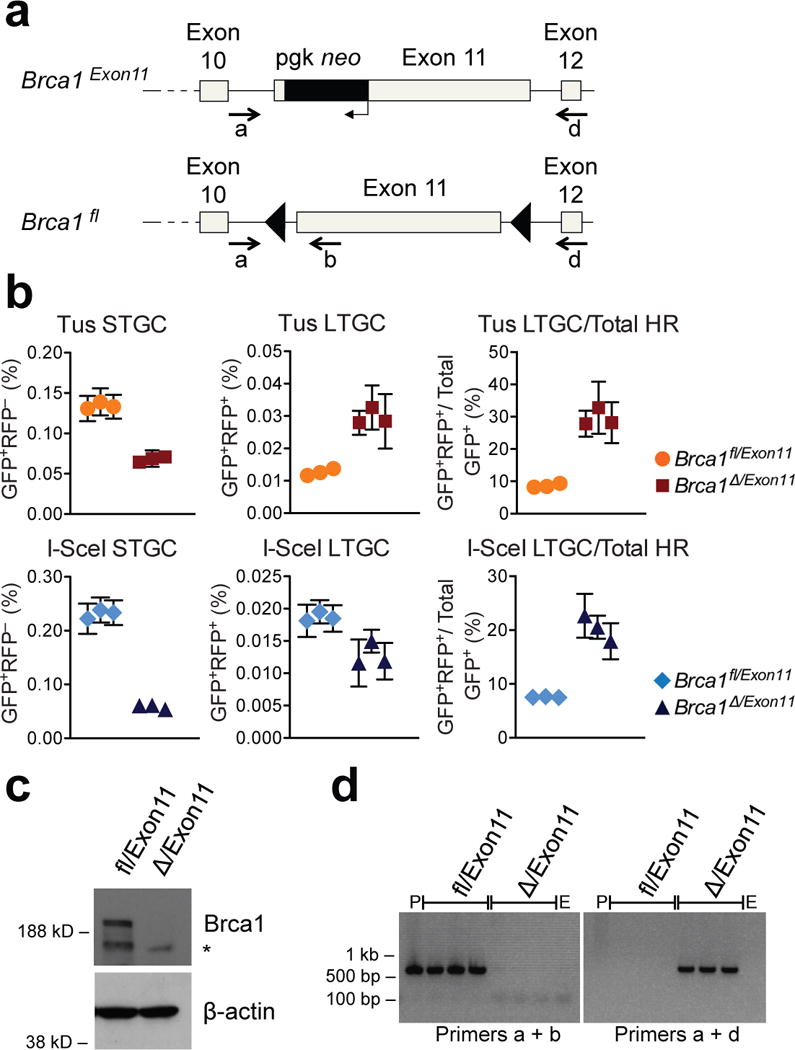
Replication fork stalling can promote genomic instability, predisposing to cancer and other diseases. Stalled replication forks may be processed by sister chromatid recombination (SCR), generating error-free or error-prone homologous recombination (HR) outcomes. In mammalian cells, a long-standing hypothesis proposes that the major hereditary breast/ovarian cancer predisposition gene products, BRCA1 and BRCA2, control HR/SCR at stalled replication forks. Although BRCA1 and BRCA2 affect replication fork processing, direct evidence that BRCA gene products regulate homologous recombination at stalled chromosomal replication forks is lacking, due to a dearth of tools for studying this process. Here we report that the Escherichia coli Tus/Ter complex can be engineered to induce site-specific replication fork stalling and chromosomal HR/SCR in mouse cells. Tus/Ter-induced homologous recombination entails processing of bidirectionally arrested forks. We find that the Brca1 carboxy (C)-terminal tandem BRCT repeat and regions of Brca1 encoded by exon 11-two Brca1 elements implicated in tumour suppression-control Tus/Ter-induced homologous recombination. Inactivation of either Brca1 or Brca2 increases the absolute frequency of 'long-tract' gene conversions at Tus/Ter-stalled forks, an outcome not observed in response to a site-specific endonuclease-mediated chromosomal double-strand break. Therefore, homologous recombination at stalled forks is regulated differently from homologous recombination at double-strand breaks arising independently of a replication fork. We propose that aberrant long-tract homologous recombination at stalled replication forks contributes to genomic instability and breast/ovarian cancer predisposition in BRCA mutant cells.


Conflict of interest statement

The authors declare that they have no competing financial interests.

Figures

Extended Data Figure 1
Extended Data Figure 1. Tus/Ter-induced replication fork stalling visualized by additional restriction digests
a, Plasmid elements as in Fig. 1a. MluI-XmnI digested plasmid yields linear fragment of 5.4 kb. Probe for Southern blotting indicated by black bar. b, Plasmid replication intermediates extracted from 293E cells transiently transfected with 6xTer-containing plasmids or “no Ter” control, co-transfected with empty vector (EV), TusH144A or wtTus as shown. All samples are from one experiment (see Source Data 2). Plasmid DNA extracted from 293E cells was digested with XmnI and MluI and analyzed by neutral/neutral 2DGE and Southern blotting. Replication intermediates as described in Fig. 1a. c, Predicted replication intermediates generated by Tus/Ter-induced replication fork stalling with or without effective FR/EBNA1 replication fork block. Diagrams below plasmid maps show shape of the major Tus/Ter-dependent fork arrest species. Green dotted line: predicted additional branch of double Y structure formed by stalling of counterclockwise fork at Tus/6xTer when FR/EBNA1 replication block fails. Length of additional branch is shown in each diagram. Note: The relationship between spots B and C will vary according to the length of this additional branch. d, Plasmid replication intermediates extracted from 293E cells transiently transfected with 6xTer-containing plasmids and co-transfected with empty vector (EV) or wtTus as shown. Restriction digests of extracted plasmids as shown. All samples are from one experiment (see Source Data 2). Note: replication fork size and position of stall spot B in relation to replication arc A varies with restriction digest. For example, spot B in KpnI-MluI is close to the 2n linear position, since the Tus/Ter-stall site is only ~680 bp from the KpnI site. For the same reason, spots B and C are closely placed in the KpnI-MluI-digested sample. Note: the relatively weak spot C in the KpnI-MluI digest, which is consistent across multiple experiments, might reflect a proportionately large contribution of ssDNA (reflecting processed lagging strand DNA) to the ~680 bp lagging strand of the stalled counterclockwise fork.
Extended Data Figure 2
Extended Data Figure 2. Estimation of efficiencies of the FR/EBNA1 and Tus/6xTer replication fork barriers
a, Tus/Ter-mediated replication stall structures responsible for spots B and C. The relative abundance of the single stall spot B and the double Y stall spot C can be used to calculate the efficiency of the FR/EBNA1 replication fork barrier. b, Phosphorimager analysis of twelve independent Southern blot experiments (method described in Fig. 1b, see Source Data 3). Note: some images shown in Source Data 3 were also used in other figures. Areas B, B′, C and C’ are the same shape and size within individual panels. Size and shape of each area varies between panels. B: stall spot B. B′: background gel signal of same area as B. C: stall spot C. C’: background gel signal of same area as C. Relative intensity of spot B/B+C estimates the stalling efficiency at FR/EBNA1 and is calculated as: (BB)/(B+CBC)×100%. The stalling efficiency at FR/EBNA1 is therefore 70% ± 2.2% (s.e.m.). Relative intensity of spot C is calculated as: (CC)/(B+CBC)×100%. c, Structure of p6xTer-2Ori plasmid. Stalled replication intermediates depict different combinations of FR/EBNA1 block/bypass and Tus/6xTer block/bypass. Spots B and B2 are defined as in the diagram. Spots C and C2 result from FR/EBNA1 bypass. Spot C2 requires successful arrest at both of the 6xTer arrays. Spot C results from bypass of one of the two 6xTer arrays. d, One of three independent experiments performed with p6xTer-2Ori. Methods as in Fig. 1b. Note presence of four stall spots in p6xTer-2Ori replicating in presence of wtTus. Double Y stall spots C and C2 and background signal C′ were quantified. Note: shape and size of each area is identical within an individual experiment, but varies between experiments (see Source Data 3). By considering only double Y stall spots (i.e., in which FR/EBNA1 bypass has occurred), the relative abundance of the double Y stall spots C and C2 are used to estimate the efficiency of the Tus/6xTer replication fork barrier. Let a = probability of the 6xTer array blocking the fork and b = probability of 6xTer bypass. Then: a+b=1. The probability of the two 6xTer arrays blocking each fork on one p6xTer-2Ori plasmid (generating spot C2) is a. The probability of one 6xTer array being blocked and the second array being bypassed (generating spot C) is 2ab. Relative densitometry of spots C and C2 (each with subtraction of background C′—Source Data 3) shows that spot C contributes 49.6% and C2 contributes 50.4% (s.e.m. 5.6%). Therefore: 0.496a2=0.504×2aba=0.67 Therefore, the estimated efficiency of the Tus/6xTer replication fork block within the replicating plasmid is 67%. Note: the efficiency of the Tus/6xTer replication fork block within the chromosome is unknown.
Extended Data Figure 3
Extended Data Figure 3. Two-ended vs. one-ended break repair models of Tus/Ter-induced HR
a, Bidirectional fork arrest would provide two DNA ends for sister chromatid recombination. Termination by annealing generates STGC products of a fixed size. Recombining GFP elements and HR reporter features other than Tus/Ter are not shown. Black strands: parental DNA. Grey strands: newly synthesized DNA. Arrow heads on DNA strands represent DNA synthesis. Blue/grey hexagons: Tus monomers. Red triangles: Ter sites. Green line: invading DNA strand. Green dotted line: nascent strand extension. b, Unidirectional fork arrest would provide only one DNA end for sister chromatid recombination. Following one-ended invasion of the neighboring sister chromatid, any STGC products could not be terminated by annealing, since there is no homologous second end. Termination by non-canonical mechanisms would generate STGCs of unpredictable/variable size, as in Chandramouly et al. DNA and protein elements labeled as in panel (a). Note 1: LTGC is not considered in this analysis, since the mechanisms of termination of the major LTGC products are not accessible from the current data. Note 2: Each model invokes a hypothetical DSB intermediate. Tus/Ter-induced HR could be initiated by a template switching mechanism (i.e., without the formation of an initiating DSB intermediate). However, the requirement for a homologous second end is not altered by consideration of a template switch model and this second end must be provided by the processing of a second arrested fork (the right-hand fork in panel a).
Extended Data Figure 4
Extended Data Figure 4. Tus/Ter-induced HR in Brca1fl/BRCT 6xTer/HR cells conforms to an affinity/avidity model
a, Primary data from Fig. 2c, showing directly measured frequencies of background HR, Tus-induced HR and I-SceI-induced HR in three independent Brca1fl/BRCT 6xTer/HR reporter clones. Cells were transfected with empty vector (EV; grey squares), myc-NLS-I-SceI (I-SceI; blue diamonds), or myc-NLS-Tus expression vectors (Tus; orange circles). Each point represents the mean of triplicate samples from three independent experiments (i.e., n=3). Error bars: s.e.m. t-test of Tus vs. EV: STGC P< 0.0001; LTGC P< 0.0001. t-test of I-SceI vs. EV: STGC P< 0.0001; LTGC P< 0.0001. t-test of Tus vs. I-SceI: STGC P <0.0001; LTGC P= 0.0018 ; LTGC/Total HR P=0.0186. b, Primary data comparing a single ROSA26 targeted Brca1fl/BRCT 6xTer/HR clone with three independently derived clones, each harboring a single intact 6xTer/HR reporter randomly integrated at an unknown locus. Filled symbols: ROSA26-targeted clone (as in panel a). Open symbols: data from randomly integrated 6xTer/HR reporter clones. Each point represents the mean of six independent experiments, triplicate replicates for each experiment (i.e., n=6). Error bars: s.e.m. t-test of pooled random integrants Tus vs. EV: STGC P< 0.0001; LTGC P< 0.0001. t-test of pooled random integrants I-SceI vs. EV: STGC P< 0.0001; LTGC P< 0.0001. t-test of pooled random integrants Tus vs. I-SceI: STGC P< 0.0001; LTGC P= 0.3620; LTGC/Total HR P= 0.00012. c, Primary data of STGC products observed in Brca1fl/BRCT 6xTer/HR cells transfected with empty vector (EV), wtTus, DNA binding defective TusH144A, lock defective TusF140A, or I-SceI. All expression vectors are codon-optimized for mammalian expression and encode N-terminal myc epitope and NLS sequences. Each column represents the mean of six independent experiments (i.e., n=6). Error bars: s.e.m. t-test of wtTus vs. EV: P= 0.0002; wtTus vs. TusH144A: P= 0.0004; wtTus vs. TusF140A: P= 0.0042; wtTus vs. I-SceI: P= 0.0139; TusH144A vs. EV: P= 0.4406; TusF140A vs. EV: P< 0.0001; TusF140A vs. TusH144A: P< 0.0001; TusF140A vs. I-SceI: P= 0.0888. d, Myc-tagged protein abundance in transfected Brca1fl/BRCT 6xTer-HR cells: EV: empty vector. Other lanes as marked. Lower panel: beta-tubulin loading control. (Source Data 4) e, Cartoons of the Ter/HR reporter constructs assayed in panel (f). f, Frequencies of Tus-induced STGC in Brca1fl/BRCT cells carrying single copy, ROSA26-targeted Ter/HR reporters shown in panel (e). Left: HR in 6xTer, 3xTer, 2xTer and 1xTer HR reporters, as shown. Right: HR in three independently derived clones carrying single copy, ROSA26-targeted 6xREVTer HR reporters. Each column represents the mean of three independent experiments (i.e., n=3). Error bars: s.e.m. t-test of 6xTer vs. 3xTer#1: P= 0.2604; 6xTer vs. 3xTer#2: P= 0.5192; 6xTer vs. 2xTer#1: P= 0.0547; 6xTer vs. 2xTer#2: P= 0.0524; 6xTer vs. 1xTer#1: P= 0.0507; 6xTer vs. 1xTer#2: P= 0.0507; 3xTer#1 vs. 3xTer#2: P= 0.8291; 3xTer#1 vs. 2xTer#1: P= 0.0650; 3xTer#1 vs. 2xTer#2: P= 0.0606; 3xTer#1 vs. 1xTer#1: P= 0.0576; 3xTer#1 vs. 1xTer#2: P= 0.0574; 3xTer#2 vs. 2xTer#1: P= 0.1832; 3xTer#2 vs. 2xTer#2: P= 0.1748; 3xTer#2 vs. 1xTer#1: P= 0.1677; 3xTer#2 vs. 1xTer#2: P= 0.1697. By one-way ANOVA (Analysis of Variance) test used to compare more than three sets of data, the trend in HR from 6x−1x p=0.0012.
Extended Data Figure 5
Extended Data Figure 5. Slx4/FancP depletion suppresses Tus/Ter-induced HR
a, Frequencies of STGC in Brca1fl/BRCT 6xTer-HR cells co-transfected with Tus (orange) or I-SceI (blue) and with either control Luciferase siRNA (si Luc), Slx4 SMARTpool (si Slx4), Slx1 SMARTpool (si Slx1), Slx1 and Slx4 SMARTpools (si Slx1 si Slx4), Eme1 SMARTpool (si Eme1), Eme1 and Slx4 SMARTpools (si Eme1 si Slx4), Xpf SMARTpool (si Xpf), Xpf and Slx4 SMARTpools (si Xpf si Slx4). Each column represents the mean of triplicate samples from four independent experiments for each clone (i.e., n=4). Error bars: s.e.m. Tus-induced HR: t-test of si Slx4 vs. si Luc: P= 0.0219; si Slx4 vs. si Slx1: P= 0.0012; si Slx4 vs. si Slx4+1: P= 0.5983; si Slx4 vs. si Eme1: P= 0.0171; si Slx4 vs. si Slx4 +si Eme1: P= 0.8721; si Slx4 vs. si Xpf: P= 0.0098; si Slx4 vs. si Slx4+ si Xpf: P= 0.4711; si Slx1 vs. si Luc: P= 0.9332; si Eme1 vs. si Luc: P= 0.4631; si Xpf vs. si Luc: P= 0.7818; si Slx4+1 vs. si Luc: P= 0.0155; si Slx4+si Eme1 vs. si Luc: P= 0.0215; si Slx4 + si Xpf vs. si Luc: P= 0.0305. I-SceI-induced HR: t-test of si Slx4 vs. si Luc: P= 0.0907; si Slx4 vs. si Slx1: P= 0.0195; si Slx4 vs. si Slx4+1: P= 0.4897; si Slx4 vs. si Eme1: P= 0.0568; si Slx4 vs. si Slx4 +si Eme1: P= 0.3411; si Slx4 vs. si Xpf: P= 0.0745; si Slx4 vs. si Slx4+ si Xpf: P= 0.2726; si Slx1 vs. si Luc: P= 0.9198; si Eme1 vs. si Luc: P= 0.3349; si Xpf vs. si Luc: P= 0.9217; si Slx4+1 vs. si Luc: P= 0.1521; si Slx4+si Eme1 vs. si Luc: P= 0.2864; si Slx4 + si Xpf vs. si Luc: P= 0.2063. b, RT qPCR analysis of mRNA exon boundaries for Slx4, Slx1, Eme1, and Xpf mRNA in siRNA-SMARTpool-treated cells used in panel (a).
Extended Data Figure 6
Extended Data Figure 6. Southern blot analysis of Tus/Ter- and I-SceI-induced HR products in Brca1Δ/BRCT 6xTer/HR cells
a, Structure of the 6xTer/HR parental reporter, and major STGC or LTGC HR products (assuming two-ended breaks). Elements as shown in Fig. 2a. b, Southern blot analysis of Tus-induced and I-SceI induced HR products in Brca1Δ/BRCT 6xTer-HR cells. P: un-rearranged reporter; STGC and LTGC as shown. SN: STGC accompanied nondisjunction with retention of parental donor reporter; LN: LTGC accompanied nondisjunction with retention of parental donor reporter. B: BglII digest. BI: BglII + I-SceI digest. Membranes probed with full length GFP cDNA. Panels underneath two SN events and one LN event show that re-cloning does not separate the two reporters, confirming that the cell contains two copies of the reporter (consistent with nondisjunction).
Extended Data Figure 7
Extended Data Figure 7. Brca1 contributes quantitatively and qualitatively to HR at stalled replication forks
a, Frequencies of Tus-induced and I-SceI-induced HR in Brca1fl/BRCT and Brca1Δ/BRCT 6xTer/HR cells transiently co-transfected with Tus, or I-SceI and with either control Luciferase siRNA (si Luc) or Brca1 SMARTpool (si Brca1). Each column represents the mean of triplicate samples for each independent clone from seven independent experiments (i.e., n=7). Error bars: s.e.m. Tus-induced HR, Brca1fl/BRCT cells, t-test si Brca1 vs. si Luc: STGC: P= 0.0013; LTGC: P= 0.0206; LTGC/total HR: P= 0.0003; Brca1Δ/BRCT cells, si Brca1 vs. si Luc: STGC: P= 0.0016; LTGC: P= 0.4558; LTGC/total HR: P< 0.0001. I-SceI-induced HR, Brca1fl/BRCT cells, t-test si Brca1 vs. si Luc: STGC: P< 0.0001; LTGC: P= 0.0033; LTGC/total HR: P= 0.9214; Brca1Δ/BRCT cells, si Brca1 vs. si Luc: STGC: P= 0.0013; LTGC: P= 0.2348; LTGC/total HR: P= 0.0071. b, Brca1 protein levels and beta-actin loading control in Brca1fl/BRCT and Brca1Δ/Exon11 in siRNA-treated cells as shown. c, RT qPCR analysis of Brca1 mRNA in siRNA-treated cells as shown. (Source Data 6.)
Extended Data Figure 8
Extended Data Figure 8. Brca2 contributes quantitatively and qualitatively to HR at stalled replication forks
a, Frequencies of Tus-induced and I-SceI-induced HR in Brca1fl/BRCT and Brca1Δ/BRCT 6xTer/HR cells transiently co-transfected with Tus, or I-SceI and with either control Luciferase siRNA (si Luc) or Brca2 SMARTpool (si Brca2). Each column represents the mean of triplicate samples for each independent clone from five independent experiments (i.e., n=5). Error bars: s.e.m. Tus-induced HR, Brca1fl/BRCT cells, t-test si Brca2 vs. si Luc: STGC: P= 0.0031; LTGC: P= 0.0007; LTGC/total HR: P= 0.0042; Brca1Δ/BRCT cells, si Brca2 vs. si Luc: STGC: P= 0.0040; LTGC: P= 0.0013; LTGC/total HR: P= 0.0006. I-SceI-induced HR, Brca1fl/BRCT cells, t-test si Brca2 vs. si Luc: STGC: P= 0.0028; LTGC: P= 0.0456; LTGC/total HR: P= 0.7945; Brca1Δ/BRCT cells, si Brca2 vs. si Luc: STGC: P= 0.0010; LTGC: P= 0.2926; LTGC/total HR: P= 0.0316. b, RT qPCR analysis of Brca2 mRNA in siRNA-treated cells as shown.
Extended Data Figure 9
Extended Data Figure 9. Rad51 contributes quantitatively and qualitatively to HR at stalled replication forks
a, Frequencies of Tus-induced and I-SceI-induced HR in Brca1fl/BRCT and Brca1Δ/BRCT 6xTer/HR cells transiently co-transfected with Tus, or I-SceI and with either control Luciferase siRNA (si Luc) or Rad51 SMARTpool (si Rad51). Each column represents the mean of triplicate samples for each independent clone from seven independent experiments for Brca1fl/BRCT (i.e., n=7) and four independent experiments for Brca1Δ/BRCT cells (i.e., n=4). Error bars: s.e.m. Tus-induced HR, Brca1fl/BRCT cells, t-test si Rad51 vs. si Luc: STGC: P< 0.0001; LTGC: P= 0.1578; LTGC/total HR: P= 0.0002; Brca1Δ/BRCT cells, si Rad51 vs. si Luc: STGC: P= 0.0010; LTGC: P= 0.0676; LTGC/total HR: P< 0.0001. I-SceI-induced HR, Brca1fl/BRCT cells, t-test si Rad51 vs. si Luc: STGC: P= 0.0014; LTGC: P= 0.0002; LTGC/total HR: P= 0.6216; Brca1Δ/BRCT cells, si Rad51 vs. si Luc: STGC: P= 0.0068; LTGC: P= 0.2064; LTGC/total HR: P= 0.0186. b, Rad51 protein levels and beta-tubulin loading control in Brca1fl/BRCT and Brca1Δ/BRCT siRNA-treated cells as shown. (Source Data 8.)
Extended Data Figure 10
Extended Data Figure 10. Effect of 53BP1 inhibition on Tus/Ter-induced HR
a, Frequencies of Tus-induced and I-SceI-induced HR in Brca1fl/BRCT and Brca1Δ/BRCT 6xTer/HR cells transiently co-transfected with Tus or I-SceI expression vectors and with either F53BP1 D1521R fragment (D1521R; non-chromatin-binding negative control for “dominant negative” 53BP1 fragment) or “dominant negative” F53BP1wt fragment (F53BP1wt). Each column represents the mean of triplicate samples for each independent clone from five independent experiments (i.e., n=5). Error bars: s.e.m. Tus-induced HR, Brca1fl/BRCT cells, t-test D1521R vs. F53BP1wt: STGC: P= 0.1818; LTGC: P= 0.9005; LTGC/total HR: P= 0.3570; Brca1Δ/BRCT cells, t-test D1521R vs. F53BP1wt: STGC: P= 0.5008; LTGC: P= 0.5375; LTGC/total HR: P= 0.4921. I-SceI-induced HR, Brca1fl/BRCT cells, t-test D1521R vs. F53BP1wt: STGC: P= 0.0442; LTGC: P= 0.5739 ; LTGC/total HR: P= 0.2250; Brca1Δ/BRCT cells, t-test D1521R vs. F53BP1wt: STGC: P= 0.0086; LTGC: P= 0.6888; LTGC/total HR: P= 0.0328. Tus-induced LTGC/total HR, Brca1fl/BRCT vs. Brca1Δ/BRCT cells, t-test F53BP1wt: 0.0064; Brca1fl/BRCT vs. Brca1Δ/BRCT cells, t-test D1521R: 0.0014; I-SceI-induced LTGC/total HR, Brca1fl/BRCT vs. Brca1Δ/BRCT cells, t-test F53BP1wt: 0.1556; Brca1fl/BRCT vs. Brca1Δ/BRCT cells, t-test D1521R: 0.0208. b, Abundance of 53BP1 fragments, and beta-tubulin (loading control) in treated Brca1fl/BRCT and Brca1Δ/BRCT 6xTer/HR reporter ES cells in (a). (Source Data 9.)
Figure 1
Figure 1. Tus/Ter-induced replication fork stalling in mammalian cells
(a) EBNA1-driven plasmid replication. Ori: EBNA1-binding origin of replication. EBNA1-binding FR repeats impede counterclockwise fork. Red triangle: 6xTer array (vertex: non-permissive end). Southern blotting probe shown. (b) Plasmid replication intermediates in 293E cells transiently transfected with 6xTer-containing plasmids or “no Ter” control, co-transfected with empty vector (EV), TusH144A or wtTus. Samples from one experiment (Source Data 1). DNA digested with XmnI+SnaBI and analyzed by 2DGE/Southern blotting. 6xREVTer: clockwise fork encounters permissive end of Ter. Cartoon: Arc “A”: replication fork. Spot “B”: Tus/Ter-stalled clockwise fork. Spot “C” : Bidirectional fork arrest (“Double Y”) at Tus/6xTer, reflecting incomplete replication block at FR. (c) Stall spot “B” quantitation, n=5 (Source Data 1). Error bars: s.e.m.: t-test 6xTer wtTus vs. any other, P<0.01. 6xREVTer wtTus vs. any other, P<0.01. 6xTer TusH144A vs. 6xTer EV, P<0.03. (d) Upper panel: Anti-myc immunoblot of 293E cells expressing empty vector (EV), wtTus (wt) or TusH144A (H). Lower panel: ß tubulin loading control.
Figure 2
Figure 2. Tus/Ter-induced homologous recombination in mammalian cells
(a) 6xTer-HR reporter and major HR products (assuming 2-ended breaks). STGC/LTGC: short/long tract gene conversion. LTGC generates wtRFP expression through RNA splicing. Grey boxes: mutant GFP. Green box: wtGFP. Circles A and B: 5′ and 3′ artificial RFP exons. Tr-GFP: 5′ truncated GFP. Red triangle: 6xTer array adjacent to I-SceI site. B: BglII; GFP-hybridizing fragment sizes in kb. Bidirectional fork stalling triggers SCR. Green arrow: strand exchange. (b) FACS data of Brca1fl/BRCT 6xTer-HR cells transfected with empty vector (EV), I-SceI, wtTus or TusH144A. “no Ter” reporter: Brca1fl/BRCT cells carrying ROSA26-targeted HR reporter lacking Ter array. (c) I-SceI- and Tus-induced HR (blue diamonds and orange circles, respectively) in three independent Brca1fl/BRCT clones. Mean of triplicate samples, n=3. Error bars: s.e.m. t-test LTGC/Total HR, I-SceI vs. Tus: P=0.0186. (d) Southern blot analysis of Tus- and I-SceI-induced HR in Brca1fl/BRCT 6xTer-HR cells (GFP probe). P: parental reporter. B: BglII digest. BI: BglII+I-SceI digest.
Figure 3
Figure 3. The Brca1 tandem BRCT repeat regulates Tus/Ter-induced HR
(a) Brca1 gene in Brca1fl/BRCT ES cells. Brca1BRCT encodes truncated protein. Cre converts Brcafl to exon 22–24-deleted Brca1Δ allele. Grey boxes: Brca1 exons; black triangles: loxP sites; pA: polyadenylation signal. SA: splice acceptor. neo: neomycin resistance gene. pgk: phosphoglycerate kinase promoter. (b) Tus- and I-SceI-induced HR in Brca1fl/BRCT and Brca1Δ/BRCT 6xTer-HR cells (three independent clones each). Mean of triplicate samples, n=4. Error bars: s.e.m. t-test Brca1fl/BRCT vs. Brca1Δ/BRCT in all 6 panels P<0.05. (c) Upper panel: endogenous Brca1 immunoblot in Brca1fl/BRCT and Brca1Δ/BRCT ES cells. *: background band. Lower panel: ß-actin loading control. (Source Data 5.) (d) RT qPCR for Brca1 mRNA. Exon 22-23 is deleted in Brca1Δ/BRCT cells.
Figure 4
Figure 4. Brca1 Exon11 regulates Tus/Ter-induced HR
(a) Brca1 gene in Brca1fl/Exon11 ES cells. Brca1Exon11 encodes Δexon11 product. Cre converts Brca1fl to exon11-deleted Brca1Δ allele. Symbols as in Fig. 3. PCR primers a, b, and d shown. (b) Tus- and I-SceI-induced HR in Brca1fl/Exon11 and Brca1Δ/Exon11 6xTer-HR cells (three independent clones each). Mean of triplicate samples, n=4. Error bars: s.e.m. t-test Brca1fl/Exon11 vs. Brca1Δ/Exon11, in all 6 panels P<0.005. (c) Upper panel: endogenous Brca1 immunoblot in Brca1fl/Exon11 and Brca1Δ/Exon11 ES cells. *: background band. Lower panel: ß-actin loading control. (Source Data 7.) (d) PCR genotyping of Brca1fl/Exon11 and Brca1Δ/Exon11 clones from panel b. P: untargeted Brca1fl/Exon11. E: “empty” (no DNA) control. Brca1fl product: 531 bp. Brca1Δ product: 621 bp.

References

    1. Ciccia A, Elledge SJ. The DNA damage response: making it safe to play with knives. Mol Cell. 2010;40:179–204. - PMC - PubMed
    1. Nagaraju G, Scully R. Minding the gap: The underground functions of BRCA1 and BRCA2 at stalled replication forks. DNA Repair (Amst) 2007 - PMC - PubMed
    1. Hastings PJ, Ira G, Lupski JR. A microhomology-mediated break-induced replication model for the origin of human copy number variation. PLoS Genetics. 2009;5:e1000327. - PMC - PubMed
    1. Kowalczykowski SC. Initiation of genetic recombination and recombination-dependent replication. Trends Biochem Sci. 2000;25:156–165. - PubMed
    1. Cox MM, et al. The importance of repairing stalled replication forks. Nature. 2000;404:37–41. - PubMed

Publication types