. 2014 Apr 29:5:3742.
doi: 10.1038/ncomms4742.

Mutation rate plasticity in rifampicin resistance depends on Escherichia coli cell-cell interactions

Affiliations
Free PMC article

Mutation rate plasticity in rifampicin resistance depends on Escherichia coli cell-cell interactions

Rok Krašovec et al. Nat Commun. .
Free PMC article

Abstract

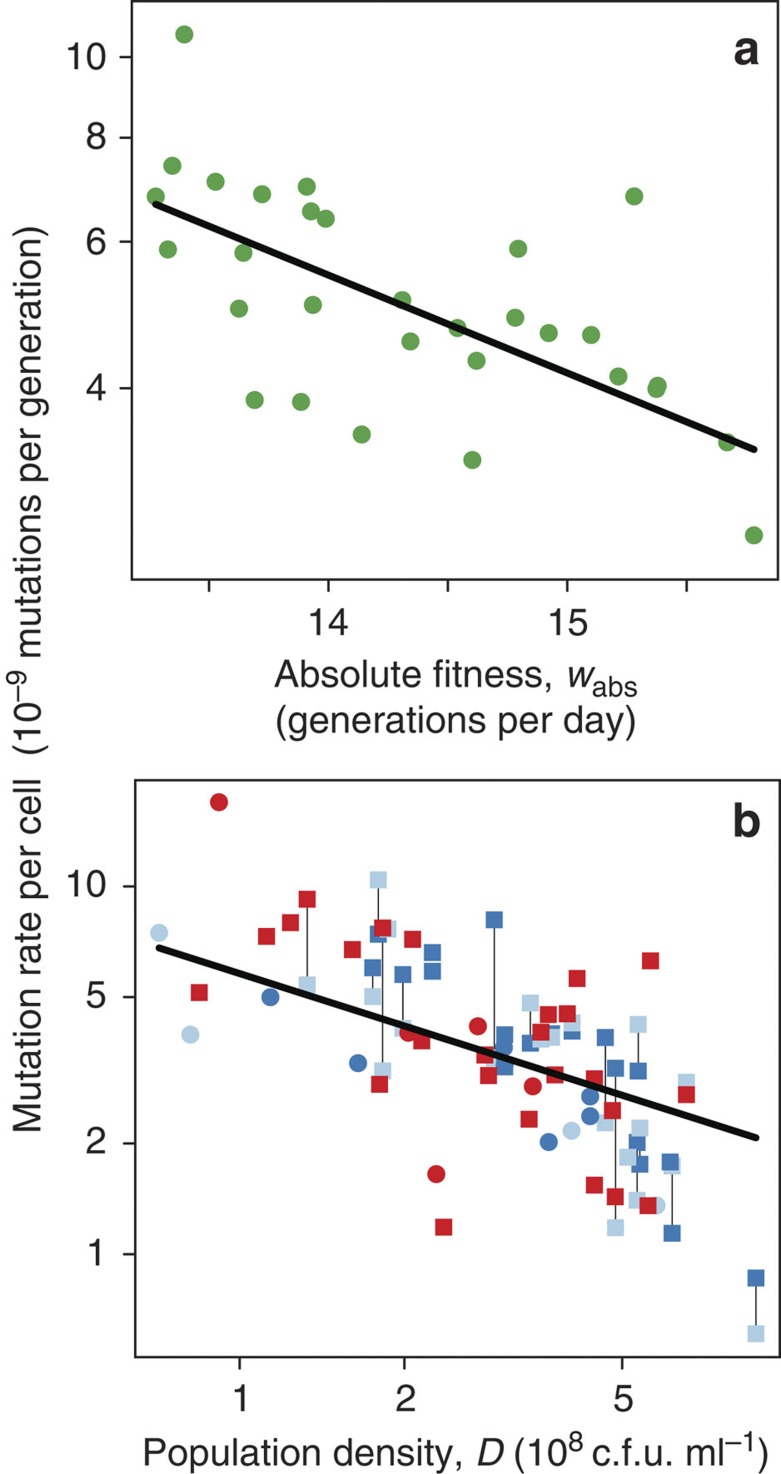
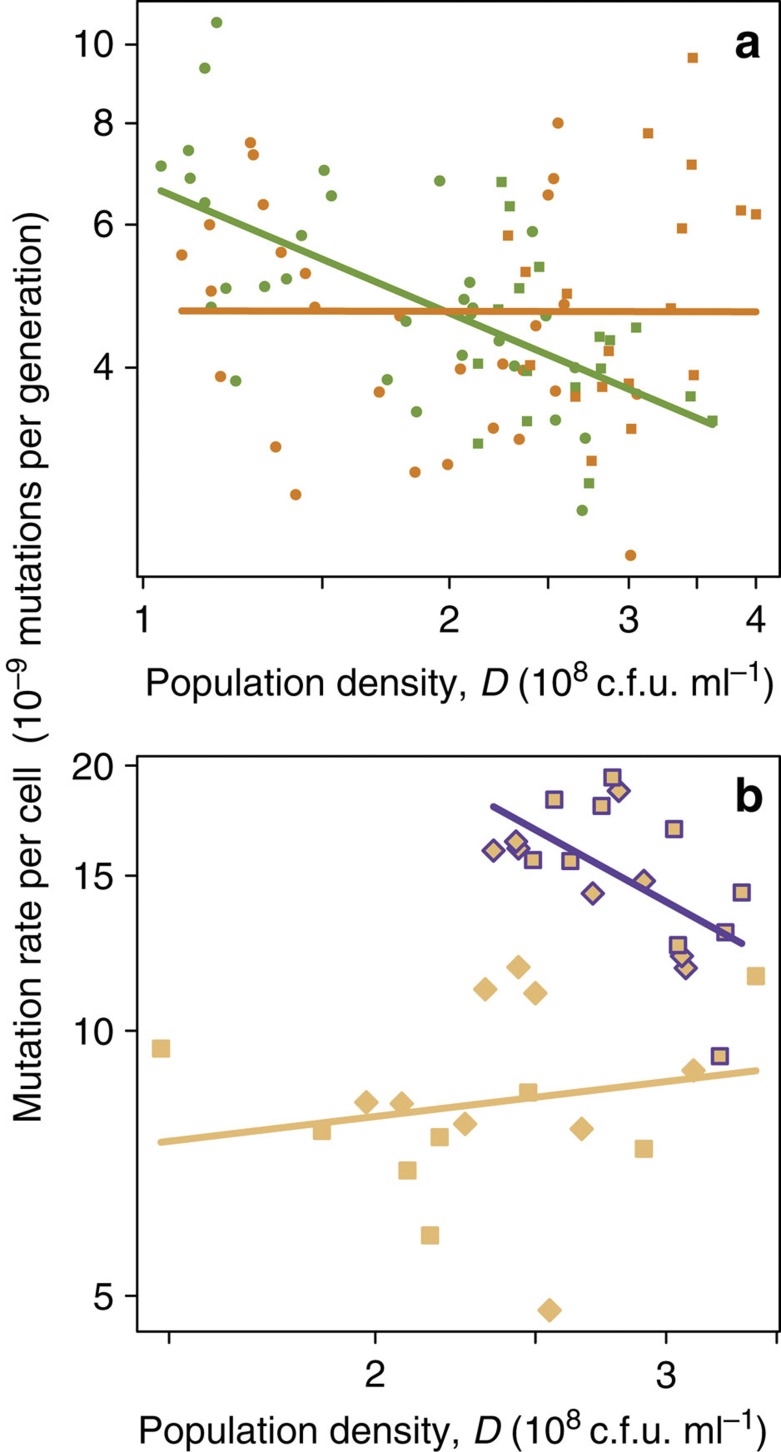
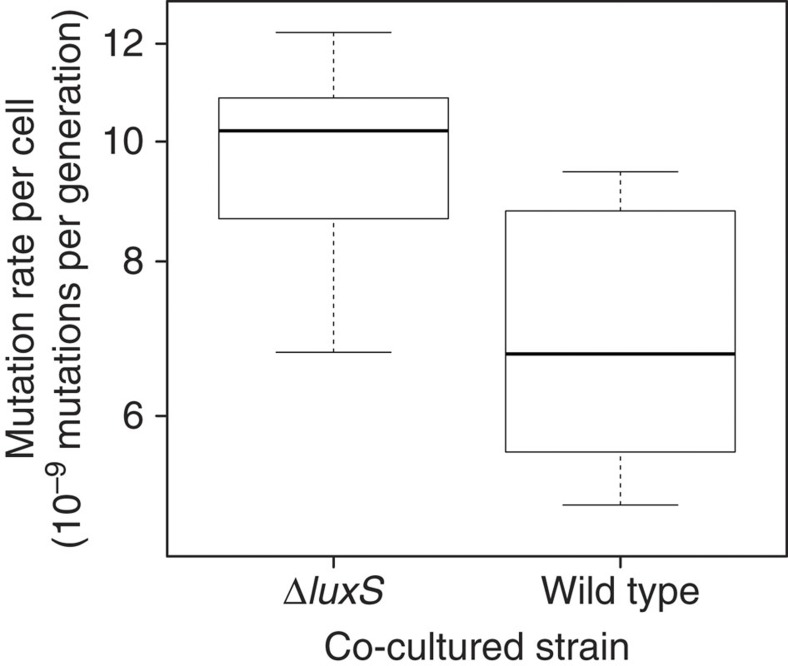
Variation of mutation rate at a particular site in a particular genotype, in other words mutation rate plasticity (MRP), can be caused by stress or ageing. However, mutation rate control by other factors is less well characterized. Here we show that in wild-type Escherichia coli (K-12 and B strains), the mutation rate to rifampicin resistance is plastic and inversely related to population density: lowering density can increase mutation rates at least threefold. This MRP is genetically switchable, dependent on the quorum-sensing gene luxS--specifically its role in the activated methyl cycle--and is socially mediated via cell-cell interactions. Although we identify an inverse association of mutation rate with fitness under some circumstances, we find no functional link with stress-induced mutagenesis. Our experimental manipulation of mutation rates via the social environment raises the possibility that such manipulation occurs in nature and could be exploited medically.


Figures

Figure 1
Figure 1. MRP in E. coli strains.
Relationship of mutation rate (μ) per cell (a) to absolute fitness (wabs) in wild-type E. coli K-12, and (b) to final population density (D) in E. coli B strains. In a, the line is the fitted curve (log2(μ)=7.9−0.39 × wabs) from Model 1 (see Methods). In b, dark and light blue indicate, respectively, the Ara (REL606) and Ara+ (REL607) ancestral B strains, and red indicates the strain evolved for 20,000 generations (REL8593A). Circles are monocultures, squares are cocultures; thin lines link estimates from two strains in the same coculture. The line is the fitted curve (log2(μ)=15−4.7 × log2(D)) from Model 2. Note that mutation rate and population density axes are logarithmic.
Figure 2
Figure 2. Role of luxS gene in MRP.
(a) Relationship of mutation rate and population density (D) in wild-type E. coli K-12 (green) and otherwise isogenic ΔluxS mutant (KX1228; orange). Lines are the fits from Model 3 (see Methods). Note that some data is common with Fig. 1a. (b) Mutation rate in E. coli ΔluxS mutant (KX1200) (cocultured with either wild-type (diamonds) or ΔluxS mutant (KX1228; squares)) cells in either aspartate-containing (outlined) or minimal (no outline) media. Lines are the fits from Model 6. Note the different logarithmic scales used in each plot; also note that the density axes are shorter than in Fig. 1b, as K-12 strains do not grow to as high density in this medium as B strains. In a, the range of densities considered is extended by including cocultures with B strains (squares), although these do not behave significantly differently to monocultures (Model 3).
Figure 3
Figure 3. Role of social context in MRP.
Mutation rate to RifR in E. coli K-12 (KX1102) dependent on cocultured strain: either wild-type or ΔluxS mutant (KX1228). Heavy bars are median values, boxes indicate the interquartile range, and whiskers indicate the maximum and minimum values recorded. Mutation rate in KX1102 is significantly different depending on the cocultured strain (N=19, F1,17=12, P=0.0034; Model 8), but not on overall culture density (Supplementary Fig. 8; Model 8). Note the logarithmic scale on the mutation rate axis.
Figure 4
Figure 4. Transcription correlations in published E. coli studies.
Selected downstream effectors associated with population density, stress, mutation control and DNA methylation are analysed. Spearman rank correlations between the expression of two genes are shown by colour. Each value is a weighted median across 96 separate studies. Associated P-values and partial correlations (controlling for the correlations among groups of genes) are given in Supplementary Fig. 11.

Comment in

References

    1. Sturtevant A. H. Essays on evolution. I. On the effects of selection on mutation rate. Q. Rev. Biol. 12, 464–467 (1937).
    1. Kimura M. On the evolutionary adjustment of spontaneous mutation rates. Genet. Res. 9, 23–34 (1967).
    1. Drake J. W., Charlesworth B., Charlesworth D. & Crow J. F. Rates of spontaneous mutation. Genetics 148, 1667–1686 (1998). - PMC - PubMed
    1. Sung W., Ackerman M. S., Miller S. F., Doak T. G. & Lynch M. Drift-barrier hypothesis and mutation-rate evolution. Proc. Natl Acad. Sci. USA 109, 18488–18492 (2012). - PMC - PubMed
    1. Lang G. I. & Murray A. W. Estimating the per-base-pair mutation rate in the yeast Saccharomyces cerevisiae. Genetics 178, 67–82 (2008). - PMC - PubMed

Publication types

LinkOut - more resources