. 2014 Jun;17(6):858-65.
doi: 10.1038/nn.3711. Epub 2014 Apr 28.

Partitioning neuronal variability

Affiliations

Partitioning neuronal variability

Robbe L T Goris et al. Nat Neurosci. 2014 Jun.

Abstract

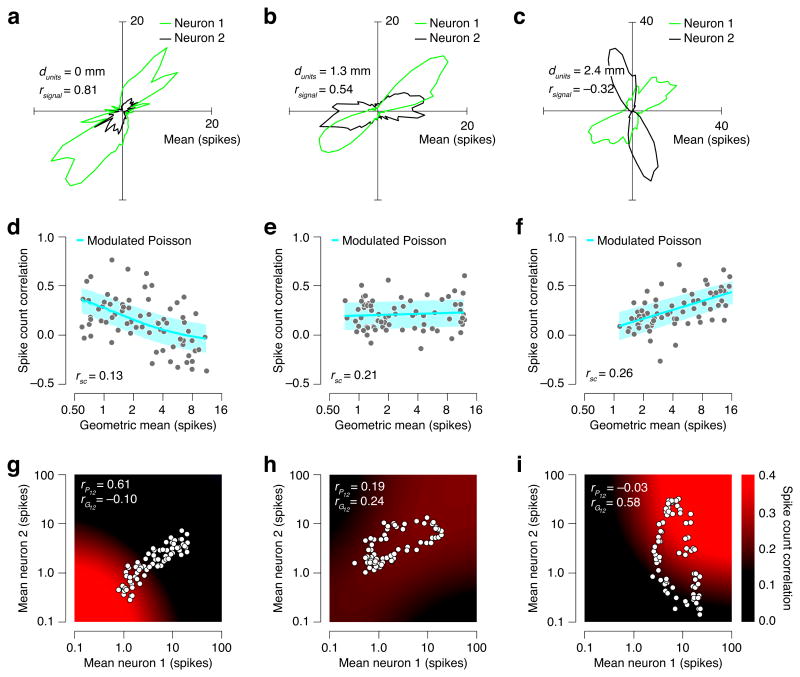
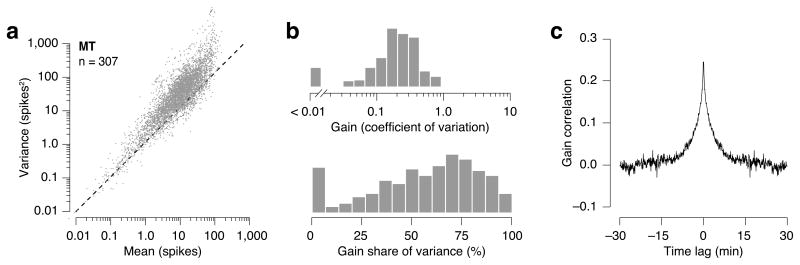
Responses of sensory neurons differ across repeated measurements. This variability is usually treated as stochasticity arising within neurons or neural circuits. However, some portion of the variability arises from fluctuations in excitability due to factors that are not purely sensory, such as arousal, attention and adaptation. To isolate these fluctuations, we developed a model in which spikes are generated by a Poisson process whose rate is the product of a drive that is sensory in origin and a gain summarizing stimulus-independent modulatory influences on excitability. This model provides an accurate account of response distributions of visual neurons in macaque lateral geniculate nucleus and cortical areas V1, V2 and MT, revealing that variability originates in large part from excitability fluctuations that are correlated over time and between neurons, and that increase in strength along the visual pathway. The model provides a parsimonious explanation for observed systematic dependencies of response variability and covariability on firing rate.


Figures

Figure 1
Figure 1
The modulated Poisson model. Spikes are generated by a Poisson process whose rate is the product of two signals: a stimulus-dependent drive, f(S), that is under experimental control, and a gain signal, G, that summarizes the net effect of stimulus-independent modulatory inputs that are assumed to fluctuate slowly relative to the duration of experimental trials.
Figure 2
Figure 2
Neural response variability originates in substantial part from gain fluctuations. (a) Actual and model-predicted response distributions for a V1 neuron, stimulated with gratings drifting in different directions. Responses were computed by counting spikes in a 1,000-ms window following response onset. The mean response varies with drift direction (center). Spike count histograms (outer ring) were calculated from 125 stimulus repetitions. Response distributions are superimposed on the best fitting probability densities of the Poisson (red) and gamma-modulated Poisson (blue) models. (b) Variance-to-mean relationship of the neural responses (grey dots, one per direction of motion), compared with predictions of the Poisson model (red line) and the modulated Poisson model (blue line). The inset shows this relation for three directions of motion (red, black, and green), where each data point is obtained from a randomly selected epoch with duration drawn uniformly from the range 1–1,000 ms in the corresponding spike raster (the red data are taken from the inset raster). Mean and variance are computed over all trials. (c) Log-probability of the cell responses under the Poisson model (red triangle) and the modulated Poisson model (blue triangle). Histograms illustrate the expected range of the log-probability statistic (computed with a 1,000 run parametric bootstrap) for the Poisson model (red) and the modulated Poisson model (blue). (d) Variance-to-mean relationships predicted by the modulated Poisson model and an additive model for weak (orange) to strong (green) fluctuations in gain.
Figure 3
Figure 3
Comparison of neural response variability for cells in different visual areas. (a) Variance-to-mean relationship for 63 LGN cells (orange), 396 V1 cells (green), 189 V2 cells (blue) and 137 MT cells (violet). Each data point illustrates the mean and variance of the spike count in a 1,000-ms window of one cell for one stimulus condition. (b) Comparison of the predictive accuracy of the Poisson and modulated Poisson models. Log-likelihood is computed for a set of hold-out data and expressed per spike (Online Methods). (c) Distribution of stimulus-independent fluctuations in gain, summarized by the coefficient of variation of the gain. Triangles indicate the median value for each area. (d) Fraction of within-condition variance explained by gain fluctuations. Asterisks (***) indicate P < 0.0001.
Figure 4
Figure 4
Response correlation analysis for three example pairs of simultaneously recorded V1 neurons. (a–c) Mean response to drifting sinusoidal gratings, as a function of direction (72 stimulus conditions, 50 repeats, 1,280-ms count window). (d–f) Spike count correlation as a function of the geometric mean of the mean spike counts of the two neurons. Each data point corresponds to a different a stimulus condition. The blue line shows the correlations predicted by the modulated Poisson model, and the surrounding light blue region indicates +/- one standard deviation of the distribution of estimates computed from 50 repeats. (g–i) Spike count correlation as a function of the mean response of the two neurons, as predicted by the modulated Poisson model (color indicates correlation, points indicate response means for different stimulus conditions, as depicted in the two tuning curves shown in the first column).
Figure 5
Figure 5
Model-based decomposition of measured spike count correlations into gain and point process correlations. (a–b) Measured spike count correlation (a), and inferred point process and gain correlations (b), as a function electrode distance. Thickness of lines indicates the 95% confidence interval. (c–d) Measured and inferred correlations plotted as a function of the correlation in mean responses (i.e., tuning curves) of the two neurons.
Figure 6
Figure 6
Gain fluctuations are correlated over time. (a) Normalized responses as a function of time for three simultaneously recorded V1 neurons. (b) The autocorrelation function of the inferred gain for the example neurons. (c) The autocorrelation function of the gain, averaged across units for each data set. (d) The cross-correlation function of the gain, averaged across pairs for each data set.
Figure 7
Figure 7
Analysis of spike count variance for a population of MT neurons recorded in awake, behaving macaques,. (a) Variance-to-mean relationship for 307 MT cells. Each data point illustrates the mean and variance of the spike count in a 2,000-ms window of one cell for one stimulus condition. (b) Distribution of stimulus-independent fluctuations in gain, summarized by the coefficient of variation of the gain (top) and fraction of within-condition variance explained by gain fluctuations (bottom). (c) The autocorrelation function of the gain, averaged across units (trials are assumed to be separated by 5 sec).

Comment in

  • Is there signal in the noise?
    Ecker AS, Tolias AS. Ecker AS, et al. Nat Neurosci. 2014 Jun;17(6):750-1. doi: 10.1038/nn.3722. Nat Neurosci. 2014. PMID: 24866037 No abstract available.

References

    1. Mainen ZF, Sejnowski TJ. Reliability of spike timing in neocortical neurons. Science. 1995;268:1503–1506. - PubMed
    1. Allen C, Stevens CF. An evaluation of causes for unreliability of synaptic transmission. Proc Natl Acad Sci USA. 1994;91(22):10380–10383. - PMC - PubMed
    1. Softky W, Koch C. The highly irregular firing of cortical cells is inconsistent with temporal integration of small EPSPs. J Neurosci. 1993;13:334–350. - PMC - PubMed
    1. Stevens CF, Zador A. When is an integrate-and-fire neuron like a Poisson neuron? In: Mozer M, Touretzky DS, Hasselmo M, editors. Advances in Neural Information Processing Systems. Vol. 8. 1996. pp. 103–109.
    1. Shadlen MN, Newsome WT. The variable discharge of cortical neurons: implications for connectivity, computation, and information coding. J Neurosci. 1998;18(10):3870–3896. - PMC - PubMed

Publication types

LinkOut - more resources