High fluoride and low calcium levels in drinking water is associated with low bone mass, reduced bone quality and fragility fractures in sheep
- PMID: 24777741
- PMCID: PMC4048471
- DOI: 10.1007/s00198-014-2707-4
High fluoride and low calcium levels in drinking water is associated with low bone mass, reduced bone quality and fragility fractures in sheep
Abstract
Chronic environmental fluoride exposure under calcium stress causes fragility fractures due to osteoporosis and bone quality deterioration, at least in sheep. Proof of skeletal fluorosis, presenting without increased bone density, calls for a review of fracture incidence in areas with fluoridated groundwater, including an analysis of patients with low bone mass.
Introduction: Understanding the skeletal effects of environmental fluoride exposure especially under calcium stress remains an unmet need of critical importance. Therefore, we studied the skeletal phenotype of sheep chronically exposed to highly fluoridated water in the Kalahari Desert, where livestock is known to present with fragility fractures.
Methods: Dorper ewes from two flocks in Namibia were studied. Chemical analyses of water, blood and urine were executed for both cohorts. Skeletal phenotyping comprised micro-computer tomography (μCT), histological, histomorphometric, biomechanical, quantitative backscattered electron imaging (qBEI) and energy-dispersive X-ray (EDX) analysis. Analysis was performed in direct comparison with undecalcified human iliac crest bone biopsies of patients with fluoride-induced osteopathy.
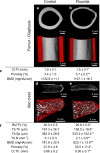
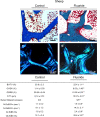
Results: The fluoride content of water, blood and urine was significantly elevated in the Kalahari group compared to the control. Surprisingly, a significant decrease in both cortical and trabecular bones was found in sheep chronically exposed to fluoride. Furthermore, osteoid parameters and the degree and heterogeneity of mineralization were increased. The latter findings are reminiscent of those found in osteoporotic patients with treatment-induced fluorosis. Mechanical testing revealed a significant decrease in the bending strength, concurrent with the clinical observation of fragility fractures in sheep within an area of environmental fluoride exposure.
Conclusions: Our data suggest that fluoride exposure with concomitant calcium deficit (i) may aggravate bone loss via reductions in mineralized trabecular and cortical bone mass and (ii) can cause fragility fractures and (iii) that the prevalence of skeletal fluorosis especially due to groundwater exposure should be reviewed in many areas of the world as low bone mass alone does not exclude fluorosis.
Figures


Similar articles
-
Deterioration of teeth and alveolar bone loss due to chronic environmental high-level fluoride and low calcium exposure.Clin Oral Investig. 2016 Dec;20(9):2361-2370. doi: 10.1007/s00784-016-1727-1. Epub 2016 Jan 28. Clin Oral Investig. 2016. PMID: 26818581
-
Marked decrease in trabecular bone quality after five years of sodium fluoride therapy--assessed by biomechanical testing of iliac crest bone biopsies in osteoporotic patients.Bone. 1994 Jul-Aug;15(4):393-9. doi: 10.1016/8756-3282(94)90815-x. Bone. 1994. PMID: 7917577 Clinical Trial.
-
Skeletal fluorosis in Vavuniya District: an observational study.Ceylon Med J. 2018 Sep 30;63(3):139-142. doi: 10.4038/cmj.v63i3.8723. Ceylon Med J. 2018. PMID: 30415519
-
Water fluoridation and osteoporotic fracture.Community Dent Health. 1996 Sep;13 Suppl 2:63-8. Community Dent Health. 1996. PMID: 8897754 Review.
-
A brief and critical review on hydrofluorosis in diverse species of domestic animals in India.Environ Geochem Health. 2018 Feb;40(1):99-114. doi: 10.1007/s10653-017-9913-x. Epub 2017 Jan 31. Environ Geochem Health. 2018. PMID: 28144801 Review.
Cited by
-
Community Water Fluoridation and Rate of Pediatric Fractures.J Am Acad Orthop Surg Glob Res Rev. 2023 Oct 5;7(10):e22.00221. doi: 10.5435/JAAOSGlobal-D-22-00221. eCollection 2023 Oct 1. J Am Acad Orthop Surg Glob Res Rev. 2023. PMID: 37796978 Free PMC article.
-
Corrosion behavior and cytocompatibility of fluoride-incorporated plasma electrolytic oxidation coating on biodegradable AZ31 alloy.Regen Biomater. 2017 Feb;4(1):1-10. doi: 10.1093/rb/rbw036. Epub 2016 Oct 26. Regen Biomater. 2017. PMID: 28149524 Free PMC article.
-
Ultra-high matrix mineralization of sperm whale auditory ossicles facilitates high sound pressure and high-frequency underwater hearing.Proc Biol Sci. 2018 Dec 19;285(1893):20181820. doi: 10.1098/rspb.2018.1820. Proc Biol Sci. 2018. PMID: 30963901 Free PMC article.
-
Vertebral bone microarchitecture and osteocyte characteristics of three toothed whale species with varying diving behaviour.Sci Rep. 2017 May 9;7(1):1604. doi: 10.1038/s41598-017-01926-7. Sci Rep. 2017. PMID: 28487524 Free PMC article.
-
A comprehensive review and advanced biomolecule-based therapies for osteoporosis.J Adv Res. 2025 May;71:337-354. doi: 10.1016/j.jare.2024.05.024. Epub 2024 May 27. J Adv Res. 2025. PMID: 38810908 Free PMC article. Review.
References
Publication types
MeSH terms
Substances
LinkOut - more resources
Full Text Sources
Other Literature Sources
Medical

