. 2014 Jul 1;307(1):H54-65.
doi: 10.1152/ajpheart.00845.2013. Epub 2014 Apr 28.

Functional deficiencies of subsarcolemmal mitochondria in the type 2 diabetic human heart

Affiliations

Functional deficiencies of subsarcolemmal mitochondria in the type 2 diabetic human heart

Tara L Croston et al. Am J Physiol Heart Circ Physiol. .

Abstract

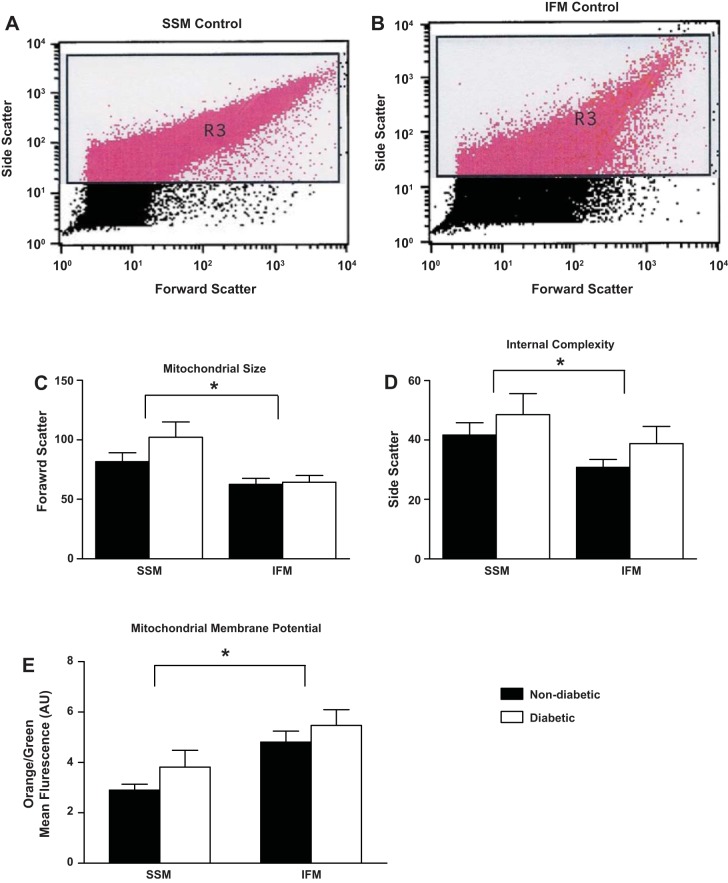
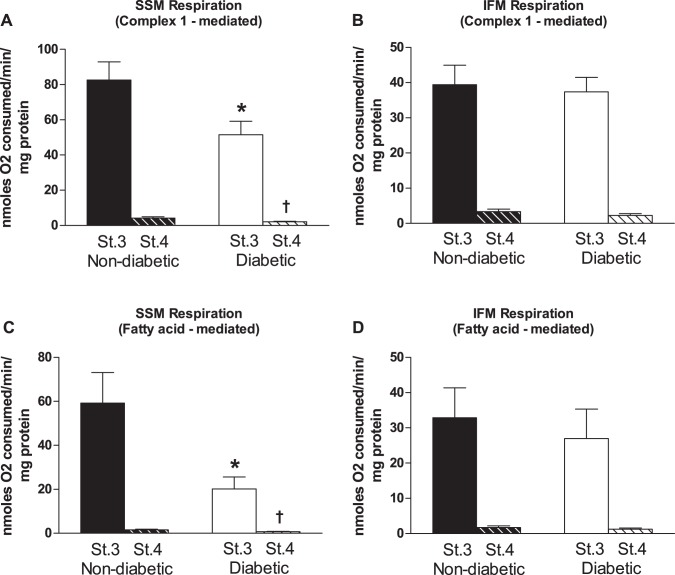
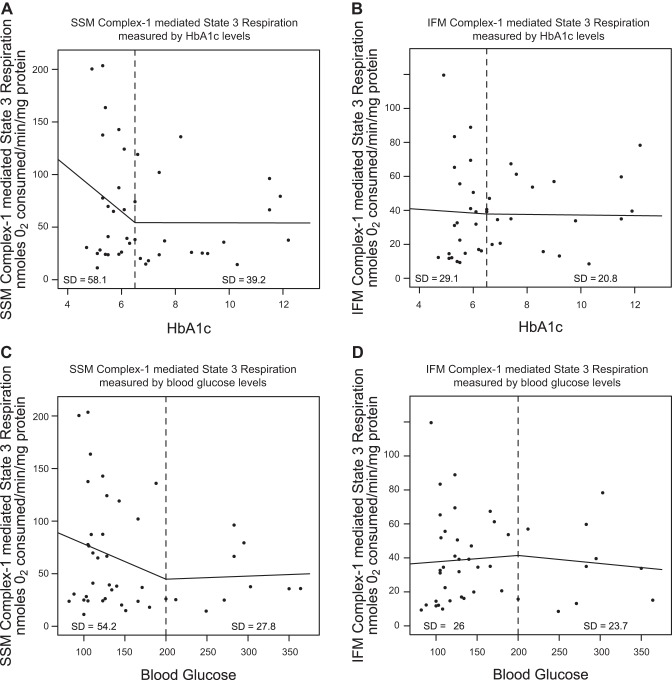
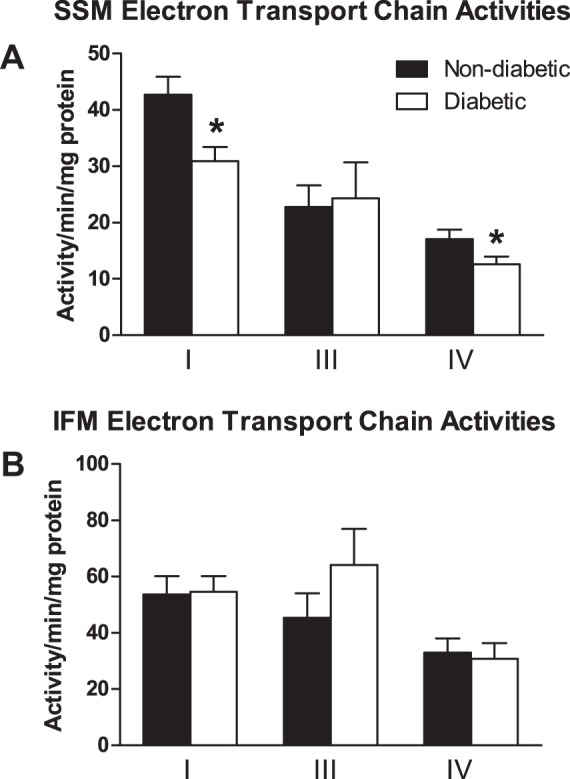
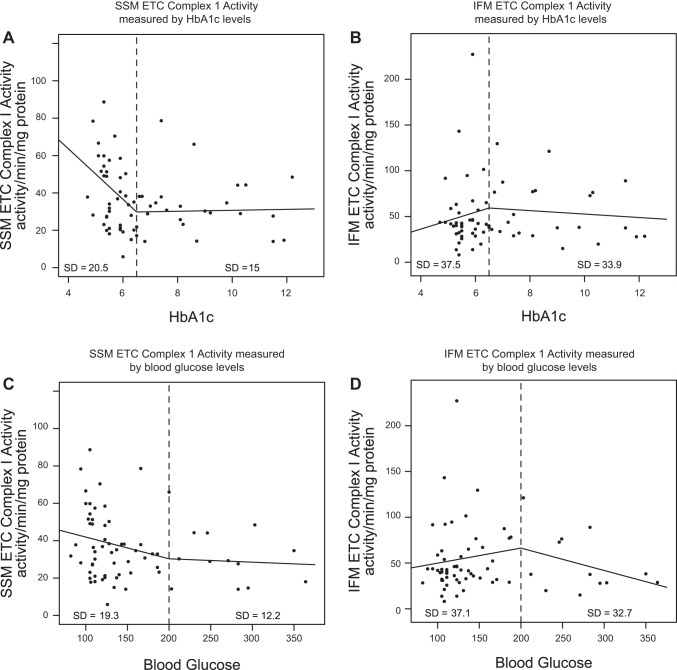
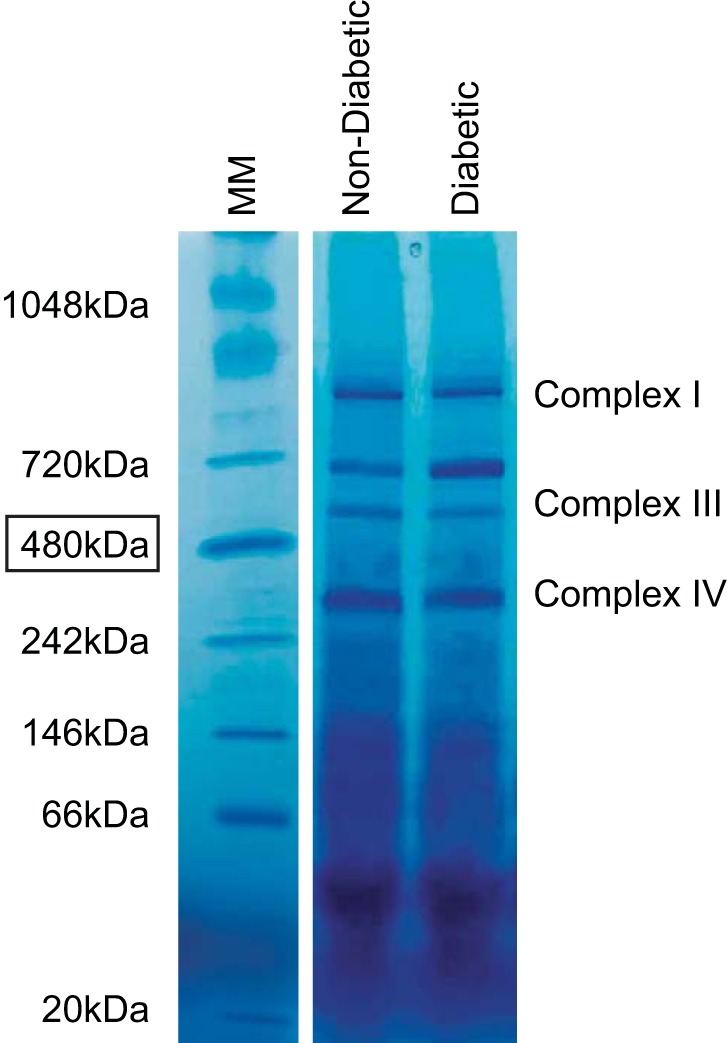
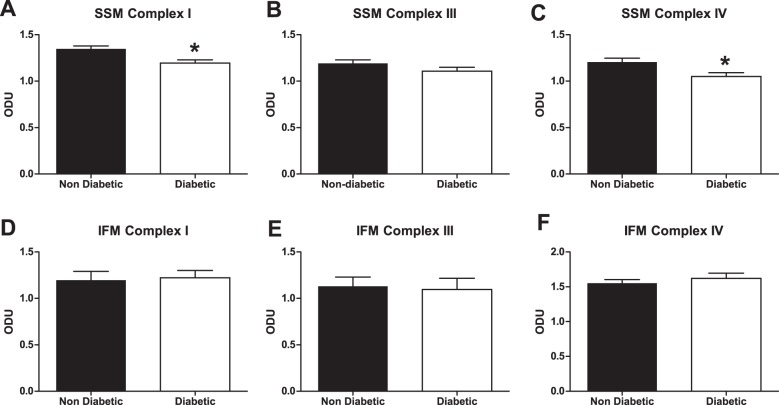
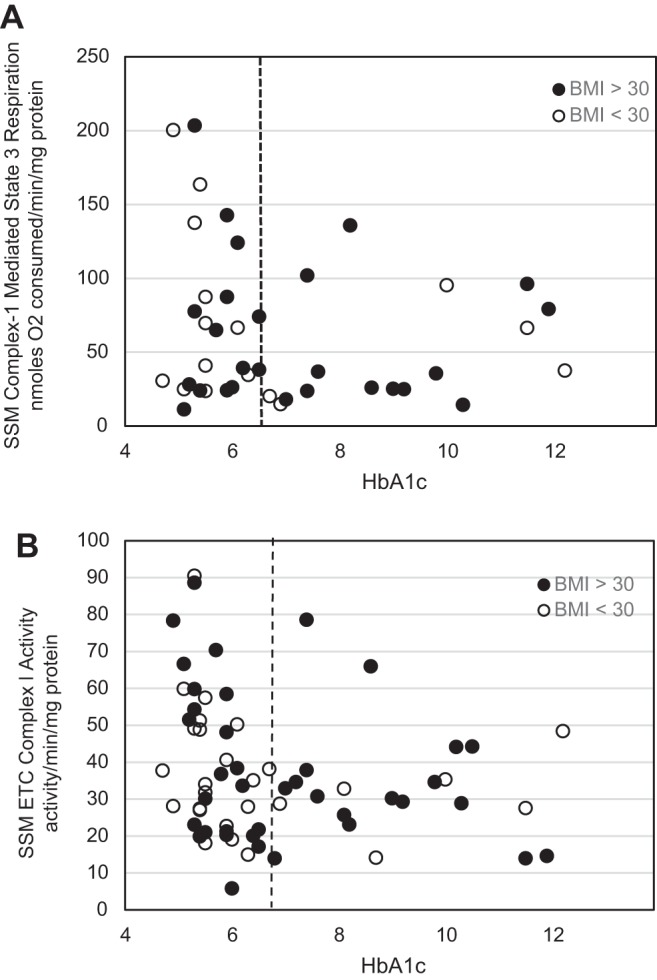
The mitochondrion has been implicated in the development of diabetic cardiomyopathy. Examination of cardiac mitochondria is complicated by the existence of spatially distinct subpopulations including subsarcolemmal (SSM) and interfibrillar (IFM). Dysfunction to cardiac SSM has been reported in murine models of type 2 diabetes mellitus; however, subpopulation-based mitochondrial analyses have not been explored in type 2 diabetic human heart. The goal of this study was to determine the impact of type 2 diabetes mellitus on cardiac mitochondrial function in the human patient. Mitochondrial subpopulations from atrial appendages of patients with and without type 2 diabetes were examined. Complex I- and fatty acid-mediated mitochondrial respiration rates were decreased in diabetic SSM compared with nondiabetic (P ≤ 0.05 for both), with no change in IFM. Electron transport chain (ETC) complexes I and IV activities were decreased in diabetic SSM compared with nondiabetic (P ≤ 0.05 for both), with a concomitant decline in their levels (P ≤ 0.05 for both). Regression analyses comparing comorbidities determined that diabetes mellitus was the primary factor accounting for mitochondrial dysfunction. Linear spline models examining correlative risk for mitochondrial dysfunction indicated that patients with diabetes display the same degree of state 3 and electron transport chain complex I dysfunction in SSM regardless of the extent of glycated hemoglobin (HbA1c) and hyperglycemia. Overall, the results suggest that independent of other pathologies, mitochondrial dysfunction is present in cardiac SSM of patients with type 2 diabetes and the degree of dysfunction is consistent regardless of the extent of elevated HbA1c or blood glucose levels.

Keywords: diabetes mellitus; diabetic cardiomyopathy; mitochondria.


Figures

Fig. 1.
Fig. 1.
Mitochondrial characteristics. Cardiac mitochondrial subpopulations were isolated and incubated with the ratiometric dye 5,5′,6,6′-tetrachloro-1,1′,3,3′-tetraethylbenzimidazol carbocyanine iodide (JC-1). Forward scatter and side scatter were used to analyze isolated mitochondria as seen by representative histograms of nondiabetic subsarcolemmal mitochondria (SSM; A) and nondiabetic interfibrillar mitochondria (IFM; B). Mitochondrial size (C) and internal complexity (D) were quantified for each mitochondrial subpopulation. By calculating the ratio of green to orange fluorescence, membrane potential (E) was quantified for nondiabetic and diabetic SSM and IFM. Black bars represent patients without diabetes, and white bars represent patients with diabetes. AU, arbitrary units. *P ≤ 0.05, SSM nondiabetic vs. IFM nondiabetic; n = 28 patients without diabetes, and n = 23 patients with diabetes.
Fig. 2.
Fig. 2.
Mitochondrial subpopulation respiration rates. Cardiac mitochondrial subpopulations were isolated and respiration rates were measured using different substrates. Glutamate and malate were used as substrates to measure maximal complex I-mediated respiration [state (St) 3 and state 4] for nondiabetic and diabetic SSM (A; state 3, n = 28 patients without diabetes and n = 23 patients with diabetes; and state 4, n = 28 patients without diabetes and n = 22 patients with diabetes) and nondiabetic and diabetic IFM (B; state 3, n = 28 patients without diabetes and n = 23 patients with diabetes; and state 4, n = 28 patients without diabetes and n = 23 patients with diabetes). Palmitoylcarnitine and malate were used as substrates to measure maximal fatty acid-mediated respiration (state 3 and state 4) for nondiabetic and diabetic SSM (C; state 3, n = 16 patients without diabetes and n = 9 patients without diabetes; and state 4, n = 15 patients without diabetes and n = 9 patients with diabetes) and nondiabetic and diabetic IFM (D; state 3, n = 16 patients without diabetes and n = 13 patients with diabetes; and state 4, n = 16 patients without diabetes and n = 13 patients with diabetes). Values are means ± SE. Units are in nanomoles O2 consumed per minute per milligram of protein. Black bars represent patients without diabetes, and white bars represent patients with diabetes. *P ≤ 0.05, state 3 SSM nondiabetic vs. state 3 SSM diabetic; †P ≤ 0.05, state 4 SSM nondiabetic vs. state 4 SSM diabetic.
Fig. 3.
Fig. 3.
Linear spline illustration for SSM state 3 respiration. Linear spline models for glycated hemoglobin (HbA1c) and state 3 mitochondrial respiration (complex I substrates) were performed with a break point at an HbA1c level equal to 6.5% (dashed line). The linear relationship before and after the break point are plotted for SSM (A) and IFM (B) with dots representing each patient with a reported HbA1c level (n = 20 patients without diabetes, and n = 23 patients with diabetes). A linear spline model for blood glucose and state 3 mitochondrial respiration was also performed with a break point at a blood glucose level equal to 200 mg/dl (dashed line). The linear relationship before and after the break point are plotted for SSM (C) and IFM (D) with dots representing each patient with an observed blood glucose level (n = 22 patients without diabetes, and n = 22 patients with diabetes). Units are nanomoles O2 consumed per minute per milligram of protein. SD, standard deviation.
Fig. 4.
Fig. 4.
Electron transport chain (ETC) activities in mitochondrial subpopulations. Cardiac mitochondrial subpopulations were isolated and ETC complex I, III, and IV activities were measured in the nondiabetic and diabetic SSM (A) and IFM (B). SSM complex I (n = 47 patients without diabetes, and n = 34 patients with diabetes) and SSM complex III and IV (n = 47 patients without diabetes and n = 33 patients with diabetes) are shown. IFM complex I (n = 46 patients without diabetes, and n = 33 patients with diabetes), IFM complex III (n = 45 patients without diabetes, and n = 33 patients with diabetes), and IFM complex IV (n = 45 patients without diabetes and n = 32 patients with diabetes) are shown. Values are means ± SE. Units are activity per minute per milligram of protein. Black bars represent patients without diabetes, and white bars represent patients with diabetes. *P ≤ 0.05, SSM nondiabetic vs. SSM diabetic (n = 47 patients without diabetes, and n = 34 patients with diabetes).
Fig. 5.
Fig. 5.
Linear spline illustration for ETC complex I activity. Linear spline models for HbA1c and ETC complex I activity were performed with a break point at an HbA1c level equal to 6.5% (dashed line). The linear relationship before and after the break point are plotted for SSM (n = 34 patients without diabetes, and n = 34 patients with diabetes; A) and IFM (n = 34 patients without diabetes, and n = 33 patients with diabetes; B) with dots representing each patient with a reported HbA1c level (n = 34 patients without diabetes, and n = 33 patients with diabetes). A linear spline model for blood glucose and ETC complex I activity was performed with a break point at a blood glucose level equal to 200 mg/dl (dashed line). The linear relationship before and after the break point are plotted for SSM (n = 36 patients without diabetes, and n = 33 patients with diabetes; C) and IFM (n = 36 patients without diabetes, and n = 32 patients with diabetes; D) with dots representing each patient with a reported blood glucose level (n = 36 patients without diabetes and n = 32 patients with diabetes). Units are activity per minute per milligram of protein.
Fig. 6.
Fig. 6.
Representative BN-PAGE gel. Cardiac mitochondrial subpopulations were isolated and subjected to blue native polyacrylamide gel electrophoresis (BN-PAGE) to visualize ETC complexes I, III, and IV. Molecular mass (MM) markers are included, and estimated band sizes indicated in kilodaltons. A representative SSM sample is included for diabetic and nondiabetic.
Fig. 7.
Fig. 7.
ETC complex expression. Cardiac mitochondrial subpopulations were isolated and subjected to BN-PAGE to assess complexes I, III, and IV contents. BN-PAGE blots for nondiabetic and diabetic SSM (A–C) and IFM (D–F) represent ETC complexes I, III, and IV, respectively. Optical density units (ODU) were calculated and values are means ± SE. Black bars represent patients without diabetes, and white bars represent patients with diabetes. n = 12 patients without diabetes, and n = 12 patients with diabetes. *P ≤ 0.05, SSM nondiabetic vs. SSM diabetic.
Fig. 8.
Fig. 8.
Linear spline illustration for state 3 mitochondrial respiration and ETC complex I activity and its relationship to body mass index. Linear spline models for HbA1c and SSM state 3 mitochondrial respiration and SSM ETC complex I activity, respectively, with a break point at an HbA1c level equal to 6.5% (dashed line) are shown. Same linear spline models as Fig. 3A (A) and Fig. 5A (B) with dots representing each patient with a reported HbA1c level are shown. White dots represent patients whose body mass index (BMI) is <30 kg/m2, whereas black dots represent patients whose BMI is >30 kg/m2. Units are nanomoles O2 consumed per minute per milligram of protein and activity per minute per milligram of protein for ETC complex I activity.

Similar articles

Cited by

References

    1. American Diabetes Association. ADA Diabetes Basics, 2013
    1. Anderson EJ, Kypson AP, Rodriguez E, Anderson CA, Lehr EJ, Neufer PD. Substrate-specific derangements in mitochondrial metabolism and redox balance in the atrium of the type 2 diabetic human heart. J Am Coll Cardiol 54: 1891–1898, 2009 - PMC - PubMed
    1. Anderson EJ, Rodriguez E, Anderson CA, Thayne K, Chitwood WR, Kypson AP. Increased propensity for cell death in diabetic human heart is mediated by mitochondrial-dependent pathways. Am J Physiol Heart Circ Physiol 300: H118–H124, 2011 - PMC - PubMed
    1. Baseler WA, Dabkowski ER, Jagannathan R, Thapa D, Nichols CE, Shepherd DL, Croston TL, Powell M, Razunguzwa TT, Lewis SE, Schnell DM, Hollander JM. Reversal of mitochondrial proteomic loss in type 1 diabetic heart with overexpression of phospholipid hydroperoxide glutathione peroxidase. Am J Physiol Regul Integr Comp Physiol 304: R553–R565, 2013 - PMC - PubMed
    1. Baseler WA, Dabkowski ER, Williamson CL, Croston TL, Thapa D, Powell MJ, Razunguzwa TT, Hollander JM. Proteomic alterations of distinct mitochondrial subpopulations in the type 1 diabetic heart: contribution of protein import dysfunction. Am J Physiol Regul Integr Comp Physiol 300: R186–R200, 2011 - PMC - PubMed

Publication types

LinkOut - more resources