

Genesis and pathogenesis of the 1918 pandemic H1N1 influenza A virus
- PMID: 24778238
- PMCID: PMC4050607
- DOI: 10.1073/pnas.1324197111
Genesis and pathogenesis of the 1918 pandemic H1N1 influenza A virus
Abstract
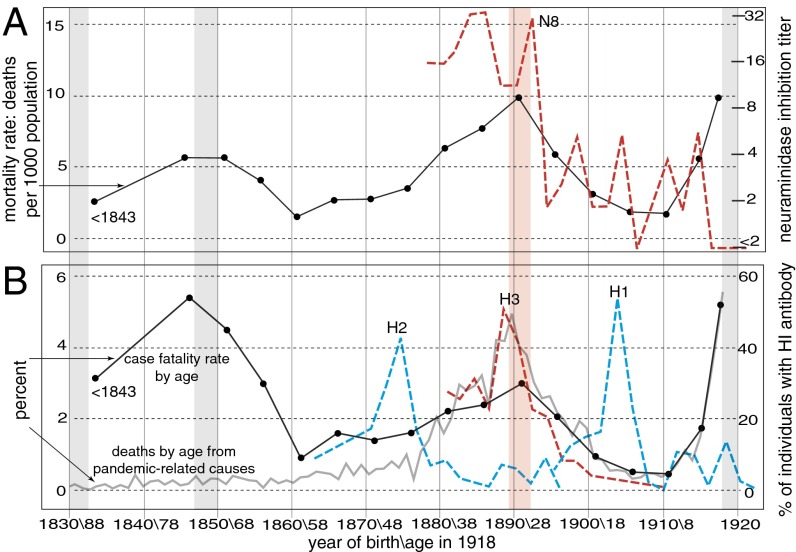
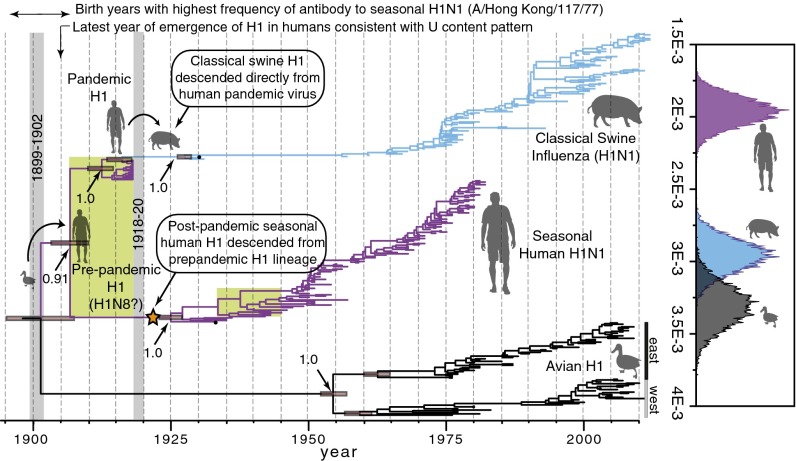
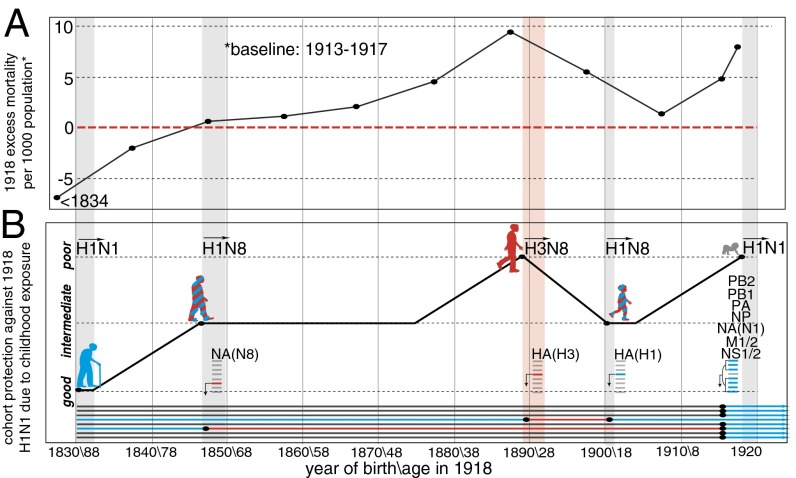
The source, timing, and geographical origin of the 1918-1920 pandemic influenza A virus have remained tenaciously obscure for nearly a century, as have the reasons for its unusual severity among young adults. Here, we reconstruct the origins of the pandemic virus and the classic swine influenza and (postpandemic) seasonal H1N1 lineages using a host-specific molecular clock approach that is demonstrably more accurate than previous methods. Our results suggest that the 1918 pandemic virus originated shortly before 1918 when a human H1 virus, which we infer emerged before ∼1907, acquired avian N1 neuraminidase and internal protein genes. We find that the resulting pandemic virus jumped directly to swine but was likely displaced in humans by ∼1922 by a reassortant with an antigenically distinct H1 HA. Hence, although the swine lineage was a direct descendent of the pandemic virus, the post-1918 seasonal H1N1 lineage evidently was not, at least for HA. These findings help resolve several seemingly disparate observations from 20th century influenza epidemiology, seroarcheology, and immunology. The phylogenetic results, combined with these other lines of evidence, suggest that the high mortality in 1918 among adults aged ∼20 to ∼40 y may have been due primarily to their childhood exposure to a doubly heterosubtypic putative H3N8 virus, which we estimate circulated from ∼1889-1900. All other age groups (except immunologically naive infants) were likely partially protected by childhood exposure to N1 and/or H1-related antigens. Similar processes may underlie age-specific mortality differences between seasonal H1N1 vs. H3N2 and human H5N1 vs. H7N9 infections.
Keywords: cohort immunity; pathogenicity; phylogeny; reassortment; virulence.
Conflict of interest statement
The authors declare no conflict of interest.
Figures
Comment in
-
Phylogenetic evidence for a mild H1 pandemic in the early 1900s.Proc Natl Acad Sci U S A. 2014 Jun 3;111(22):7892-3. doi: 10.1073/pnas.1406869111. Epub 2014 May 27. Proc Natl Acad Sci U S A. 2014. PMID: 24911006 Free PMC article. No abstract available.
References
-
- Frost WH. The epidemiology of influenza. JAMA. 1919;73(5):313–318.
-
- Morens DM, Fauci AS. The 1918 influenza pandemic: Insights for the 21st century. J Infect Dis. 2007;195(7):1018–1028. - PubMed
-
- Luk J, Gross P, Thompson WW. Observations on mortality during the 1918 influenza pandemic. Clin Infect Dis. 2001;33(8):1375–1378. - PubMed
Publication types
MeSH terms
Grants and funding
LinkOut - more resources
Full Text Sources
Other Literature Sources
Medical
