. 2014 May 20;111(20):E2149-56.
doi: 10.1073/pnas.1405641111. Epub 2014 Apr 28.

Syntrophic exchange in synthetic microbial communities

Affiliations

Syntrophic exchange in synthetic microbial communities

Michael T Mee et al. Proc Natl Acad Sci U S A. .

Abstract

Metabolic crossfeeding is an important process that can broadly shape microbial communities. However, little is known about specific crossfeeding principles that drive the formation and maintenance of individuals within a mixed population. Here, we devised a series of synthetic syntrophic communities to probe the complex interactions underlying metabolic exchange of amino acids. We experimentally analyzed multimember, multidimensional communities of Escherichia coli of increasing sophistication to assess the outcomes of synergistic crossfeeding. We find that biosynthetically costly amino acids including methionine, lysine, isoleucine, arginine, and aromatics, tend to promote stronger cooperative interactions than amino acids that are cheaper to produce. Furthermore, cells that share common intermediates along branching pathways yielded more synergistic growth, but exhibited many instances of both positive and negative epistasis when these interactions scaled to higher dimensions. In more complex communities, we find certain members exhibiting keystone species-like behavior that drastically impact the community dynamics. Based on comparative genomic analysis of >6,000 sequenced bacteria from diverse environments, we present evidence suggesting that amino acid biosynthesis has been broadly optimized to reduce individual metabolic burden in favor of enhanced crossfeeding to support synergistic growth across the biosphere. These results improve our basic understanding of microbial syntrophy while also highlighting the utility and limitations of current modeling approaches to describe the dynamic complexities underlying microbial ecosystems. This work sets the foundation for future endeavors to resolve key questions in microbial ecology and evolution, and presents a platform to develop better and more robust engineered synthetic communities for industrial biotechnology.

Keywords: amino acid exchange; population modeling; synthetic ecosystem.


Conflict of interest statement

The authors declare no conflict of interest.

Figures

Fig. 1.
Fig. 1.
Metabolic crossfeeding in syntrophic communities. (A) An illustration of engineered syntrophic interactions between microbial communities of increasing complexity toward network hierarchies matching those of natural systems. (B) Relationship between number of supplemented amino acid needed to make one E. coli cell in log10 units versus biosynthetic cost to produce each amino acid. (C) Syntrophic growth yield after 84 h between 14 single-KO auxotrophs (strain 1) and all pairwise combinations (strain 2). Color intensity indicated in the color bar denotes fold growth after 84 h over initial population. (D) Simple two-equation dynamic model that captures the essential features of the pairwise consortium. Cooperativity coefficients C1,2 and C2,1 can be determined through the total coculture growth curve (solid red line), the end point cell density of each strain (solid dots), and the simulated growth profile of each strain (black dotted lines). Control populations of only strain 1 or strain 2 (respectively ∆M and ∆F in this example) separately show no growth (solid black line).
Fig. 2.
Fig. 2.
Three-member syntrophic consortia with each strain being auxotrophic for two amino acids. All combinations of 14 × 14 × 14 three-way interactions are measured after 84 h of growth. Fourteen 14 × 14 panels are presented showing the growth yield of each three-member group. Each 14 × 14 panel correspond to a fixed strain 1 (blue color) against all combination of strains 2 and 3. The ordinate axis denote different strain 2 (orange color), and the abscissa axis denote different strain 3 (green color). The key for strain 1 designation is shown in the second panel. The first panel illustrates an example consortium of KS-IS-IK with the crossfeeding amino acids shown by the correspondingly colored arrows. Color intensity indicated in the color bar denotes fold growth after 84 h over initial population.
Fig. 3.
Fig. 3.
Comparison of three-member syntrophies composed of double auxotrophs against two-member composed of single auxotrophs. (A) The sums of the final OD values for all two- or three-member communities containing a given auxotroph are normalized to the highest value (∆M for both two- and three-member systems) to represent the syntrophic exchange growth potential of a given amino acid. This is termed the growth index for the three-member or two-member scenarios and shows consistent relationship when crossfeeding is scaled to higher dimensions. (B) Observed three-member growth (ordinate axis) for all 364 triplets versus the mean growth of their three corresponding two-member subsets (abscissa axis). Each point corresponds to a specific three-member group. Color intensity of each point designates the lowest growth yield of the three two-member subset and is mapped based on color bar using numerical values of fold growth (0–15+). Zones 1–4 are designated in the dotted regions (see text for detail). (C) Growth yield of top three-member consortia that grow better than their corresponding two-member subsets. The black bar indicates growth of three member. The red bar is the highest growth yield of the three two-member subsets. The corresponding three amino acids are shown in the bottom panel (read vertically) for each triplet. Two red boxes for each triplet designate the best two-member subset.
Fig. 4.
Fig. 4.
Dynamics of a 14-member syntrophic consortium. (A) Fourteen different single-amino acid auxotrophs where combined in equal ratios to form a pooled mixture and passaged daily in minimal media over 50 d. Samples of the population were periodically measured to determine the absolute and relative abundance of each of the 14 auxotrophs. (B) Syntrophic interaction map generated from all measured 91 pairwise crossfeeding experiments. Each auxotroph is designated by a circle and a different color. The arrowed lines correspond to the directional interaction from each strain to all 13 corresponding partners. Lines are color-coded according to the directional benefit the receiving strain is gaining from the donor strain (e.g., all incoming lines to the K auxotroph are red, designating the benefit gained by K from each donor). Increased thickness and opacity of the lines quantitatively denote increased cooperative benefits. (C) Population distribution of two biological replicate 14-member populations over 50 daily passages. Each colored bar section denotes the fractional composition of each auxotroph in the population. Color coding is the same as that of A and B. (D) Subsequent short-term 7-d experiments of the 14-member population as well as 13-member populations that excluded one of four dominant amino acids (K, R, T, or M) from the initial population. The syntrophic interaction network is shown below each panel. We denoted cooperative interactions with bidirectional black arrows and competitive (seemingly inhibitory) effects by directional blunted red arrows. Each auxotroph dropout and their associated interactions are shown in faded colors. Transient cooperative interactions are shown as dotted gray arrowed lines. The black circles around each amino acid designate final fixation to a stable community of two to five members. Values are derived from the average of three to four biological replicates. Time series data are included in Dataset S2.
Fig. 5.
Fig. 5.
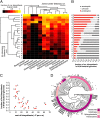
Amino acid biosynthesis in the microbiome. (A) Heat map of amino acid biosynthetic capabilities of the indicated phyla and classes. Prototrophy predictions for each amino acid are averaged within groups. Phyla and classes with fewer than 20 of the 2,099 sequenced bacterial are excluded from the analysis. Value of 1/0 indicates all/none of the species in the group are prototrophic. Dendograms represent clustering of both phylogenetic distribution (based on median 16S sequence from each clade) and amino acid production profiles. Phylum/class leaf branches are not to scale to enhance higher-order relationships. (B) Distribution of amino acid biosynthetic capability of 6,120 sequenced bacteria. The red bars indicate complete pathway present. Incomplete or unknown pathways are denoted in black and gray bars, respectively. (C) Amino acid biosynthesis distribution plotted against metabolic cost of synthesizing each amino acid in terms of number of phosphates required. (D) Prototrophy distribution in Bacteroidetes. The black rings indicate biosynthesis of each amino acid in increasing order of prevalence from inner to outer rings (E, G, N, D, Q, C, A, S, V, I, P, K, L, W, H, M, R; T, F, Y not present).

References

    1. Brenner K, You L, Arnold FH. Engineering microbial consortia: A new frontier in synthetic biology. Trends Biotechnol. 2008;26(9):483–489. - PubMed
    1. Mee MT, Wang HH. Engineering ecosystems and synthetic ecologies. Mol Biosyst. 2012;8(10):2470–2483. - PMC - PubMed
    1. Shong J, Jimenez Diaz MR, Collins CH. Towards synthetic microbial consortia for bioprocessing. Curr Opin Biotechnol. 2012;23(5):798–802. - PubMed
    1. Minty JJ, et al. Design and characterization of synthetic fungal-bacterial consortia for direct production of isobutanol from cellulosic biomass. Proc Natl Acad Sci USA. 2013;110(36):14592–14597. - PMC - PubMed
    1. Bayer TS, et al. Synthesis of methyl halides from biomass using engineered microbes. J Am Chem Soc. 2009;131(18):6508–6515. - PubMed

Publication types

LinkOut - more resources