

Seasonality of tuberculosis in delhi, India: a time series analysis
- PMID: 24778871
- PMCID: PMC3981520
- DOI: 10.1155/2014/514093
Seasonality of tuberculosis in delhi, India: a time series analysis
Abstract
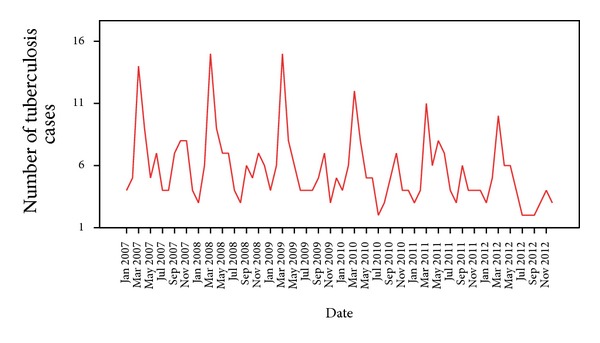
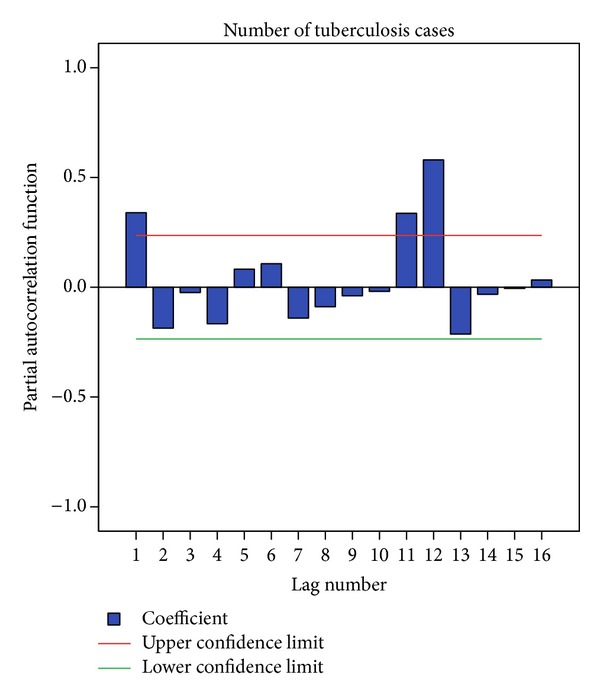
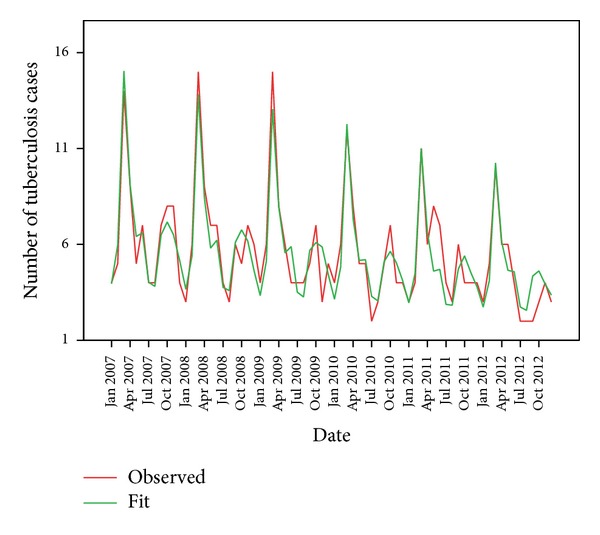
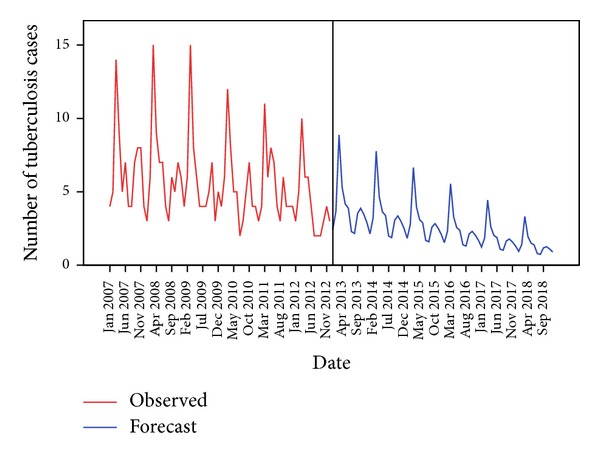
Background. It is highly cost effective to detect a seasonal trend in tuberculosis in order to optimize disease control and intervention. Although seasonal variation of tuberculosis has been reported from different parts of the world, no definite and consistent pattern has been observed. Therefore, the study was designed to find the seasonal variation of tuberculosis in Delhi, India. Methods. Retrospective record based study was undertaken in a Directly Observed Treatment Short course (DOTS) centre located in the south district of Delhi. Six-year data from January 2007 to December 2012 was analyzed. Expert modeler of SPSS ver. 21 software was used to fit the best suitable model for the time series data. Results. Autocorrelation function (ACF) and partial autocorrelation function (PACF) at lag 12 show significant peak suggesting seasonal component of the TB series. Seasonal adjusted factor (SAF) showed peak seasonal variation from March to May. Univariate model by expert modeler in the SPSS showed that Winter's multiplicative model could best predict the time series data with 69.8% variability. The forecast shows declining trend with seasonality. Conclusion. A seasonal pattern and declining trend with variable amplitudes of fluctuation were observed in the incidence of tuberculosis.
Figures
Similar articles
-
Seasonality and trend analysis of tuberculosis in Lahore, Pakistan from 2006 to 2013.J Epidemiol Glob Health. 2015 Dec;5(4):397-403. doi: 10.1016/j.jegh.2015.07.007. Epub 2015 Aug 28. J Epidemiol Glob Health. 2015. PMID: 26318884 Free PMC article.
-
Forecasting malaria cases using climatic factors in delhi, India: a time series analysis.Malar Res Treat. 2014;2014:482851. doi: 10.1155/2014/482851. Epub 2014 Jul 23. Malar Res Treat. 2014. PMID: 25147750 Free PMC article.
-
Seasonal patterns of tuberculosis case notification in the tropics of Africa: A six-year trend analysis in Ethiopia.PLoS One. 2018 Nov 26;13(11):e0207552. doi: 10.1371/journal.pone.0207552. eCollection 2018. PLoS One. 2018. PMID: 30475836 Free PMC article.
-
Drivers of Seasonal Variation in Tuberculosis Incidence: Insights from a Systematic Review and Mathematical Model.Epidemiology. 2018 Nov;29(6):857-866. doi: 10.1097/EDE.0000000000000877. Epidemiology. 2018. PMID: 29870427 Free PMC article.
-
[Seasonal variation and related influencing factors for tuberculosis].Zhonghua Liu Xing Bing Xue Za Zhi. 2016 Aug 10;37(8):1183-6. doi: 10.3760/cma.j.issn.0254-6450.2016.08.025. Zhonghua Liu Xing Bing Xue Za Zhi. 2016. PMID: 27539356 Review. Chinese.
Cited by
-
Trend Analysis And Seasonality Of Tuberculosis Among Patients At The Hiwot Fana Specialized University Hospital, Eastern Ethiopia: A Retrospective Study.Risk Manag Healthc Policy. 2019 Dec 11;12:297-305. doi: 10.2147/RMHP.S228659. eCollection 2019. Risk Manag Healthc Policy. 2019. PMID: 31849546 Free PMC article.
-
Seasonality of childhood tuberculosis cases in Kampala, Uganda, 2010-2015.PLoS One. 2019 Apr 9;14(4):e0214555. doi: 10.1371/journal.pone.0214555. eCollection 2019. PLoS One. 2019. PMID: 30964908 Free PMC article.
-
Trends in incidence and mortality of tuberculosis in India over past three decades: a joinpoint and age-period-cohort analysis.BMC Pulm Med. 2021 Nov 16;21(1):375. doi: 10.1186/s12890-021-01740-y. BMC Pulm Med. 2021. PMID: 34784911 Free PMC article.
-
Estimating the incidence of tuberculosis cases reported at a tertiary hospital in Ghana: a time series model approach.BMC Public Health. 2018 Nov 26;18(1):1292. doi: 10.1186/s12889-018-6221-z. BMC Public Health. 2018. PMID: 30477460 Free PMC article.
-
Time series of cases and treatment outcomes from tuberculosis in Sergipe, 2012-2021.Rev Bras Epidemiol. 2023 Sep 18;26:e230041. doi: 10.1590/1980-549720230041. eCollection 2023. Rev Bras Epidemiol. 2023. PMID: 37729348 Free PMC article.
References
-
- Dye C. Global epidemiology of tuberculosis. The Lancet. 2006;367(9514):938–940. - PubMed
-
- World Health Organization. Global Tuberculosis Control. Geneva, Switzerland: World Health Organization; 2010.
-
- Nagayama N, Ohmori M. Seasonality in various forms of tuberculosis. International Journal of Tuberculosis and Lung Disease. 2006;10(10):1117–1122. - PubMed
-
- Ríos M, García JM, Sánchez JA, Pérez D. A statistical analysis of the seasonality in pulmonary tuberculosis. European Journal of Epidemiology. 2000;16(5):483–488. - PubMed
-
- Thorpe LE, Frieden TR, Laserson KF, Wells C, Khatri GR. Seasonality of tuberculosis in India: is it real and what does it tell us? The Lancet. 2004;364(9445):1613–1614. - PubMed
LinkOut - more resources
Full Text Sources
Other Literature Sources
