. 2014 May 27;8(5):5199-207.
doi: 10.1021/nn501250e. Epub 2014 May 5.

Taking the temperature of the interiors of magnetically heated nanoparticles

Affiliations

Taking the temperature of the interiors of magnetically heated nanoparticles

Juyao Dong et al. ACS Nano. .

Abstract

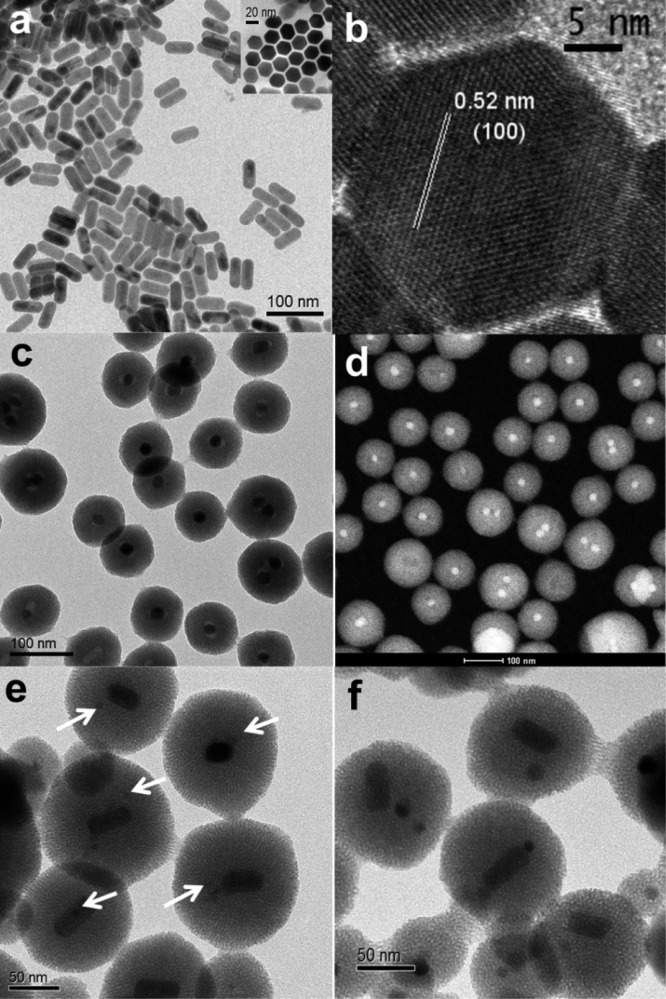
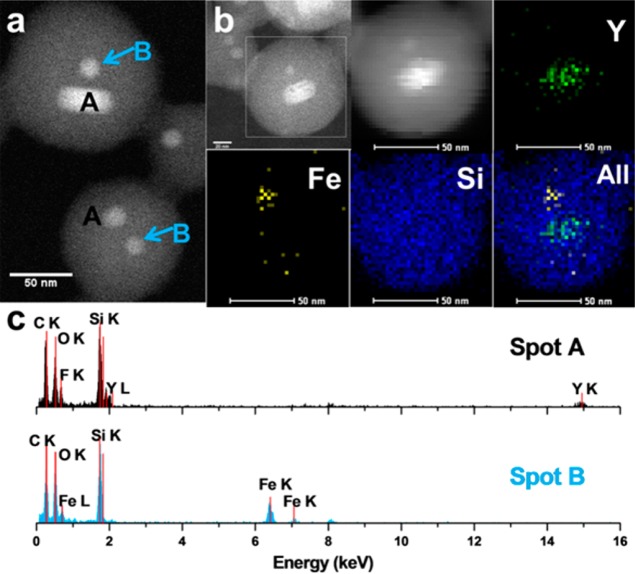
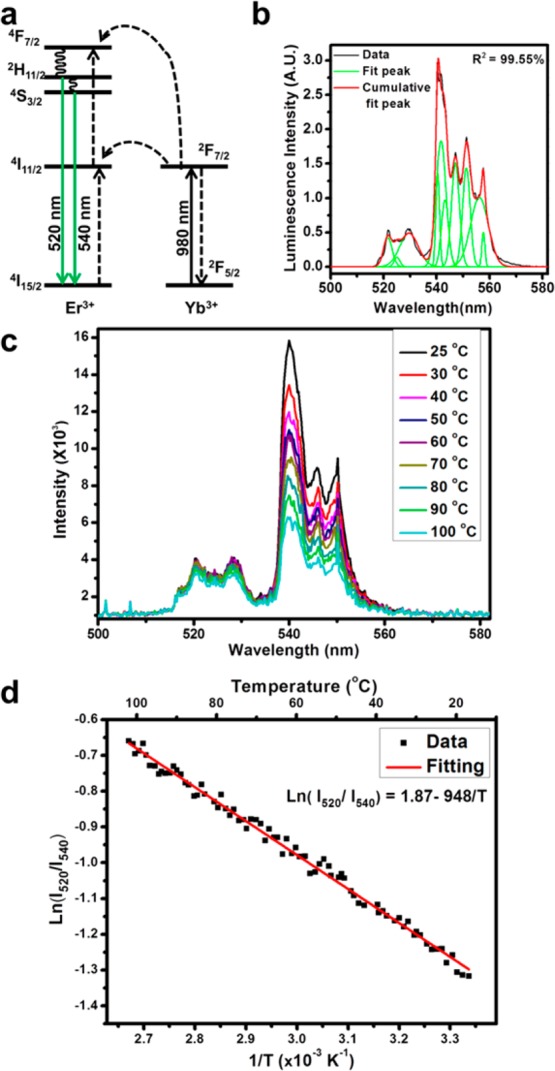
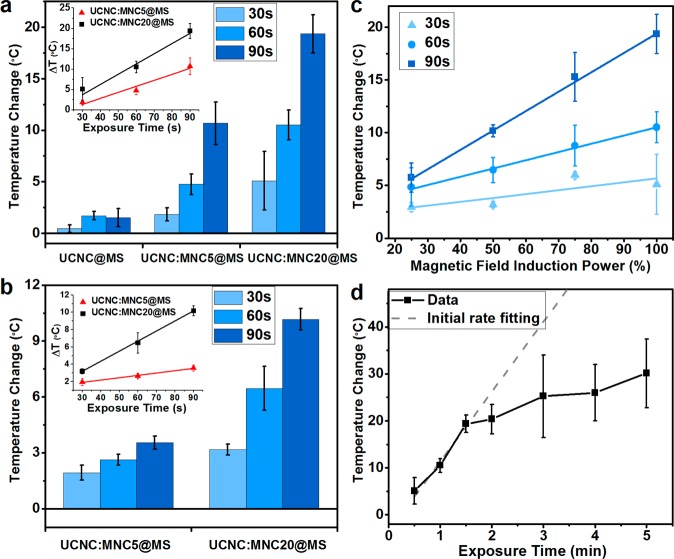
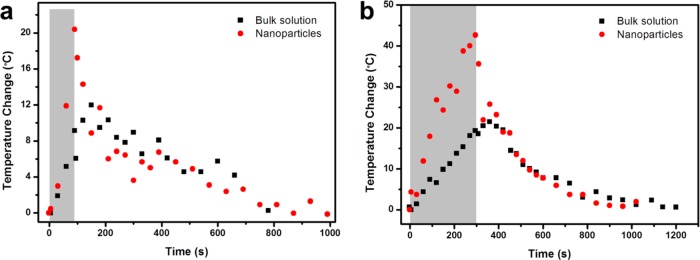
The temperature increase inside mesoporous silica nanoparticles induced by encapsulated smaller superparamagnetic nanocrystals in an oscillating magnetic field is measured using a crystalline optical nanothermometer. The detection mechanism is based on the temperature-dependent intensity ratio of two luminescence bands in the upconversion emission spectrum of NaYF4:Yb(3+), Er(3+). A facile stepwise phase transfer method is developed to construct a dual-core mesoporous silica nanoparticle that contains both a nanoheater and a nanothermometer in its interior. The magnetically induced heating inside the nanoparticles varies with different experimental conditions, including the magnetic field induction power, the exposure time to the magnetic field, and the magnetic nanocrystal size. The temperature increase of the immediate nanoenvironment around the magnetic nanocrystals is monitored continuously during the magnetic oscillating field exposure. The interior of the nanoparticles becomes much hotter than the macroscopic solution and cools to the temperature of the ambient fluid on a time scale of seconds after the magnetic field is turned off. This continuous absolute temperature detection method offers quantitative insight into the nanoenvironment around magnetic materials and opens a path for optimizing local temperature controls for physical and biomedical applications.


Figures

Figure 1
Figure 1
Transmission electron microscopy (TEM), high-resolution transmission electron microscopy (HRTEM), and scanning transmission electron microscopy (STEM) images of nanoparticles. (a) TEM image of UCNCs with an average crystal size of 49 ± 2 nm long and 23 ± 1 nm wide. The inset shows the hexagonal side of the nanocrystals. (b) HRTEM of UCNCs, confirming the hexagonal lattice structure. (c, d) TEM and STEM image of control group UCNC@MS. (e) TEM images of dual-core nanoparticles UCNC:MNC5@MS (arrows point to the MNCs). (f) TEM images of dual-core silica nanoparticles UCNC:MNC20@MS, with both the UCNCs and the 20 nm MNCs. Scale bars, 100 nm (a, c, d), 50 nm (e, f), 20 nm (a inset), 5 nm (b).
Figure 2
Figure 2
STEM image and elemental analysis of UCNC:MNC20@MS. (a) STEM image, scale bar: 50 nm. The spots A and B have different EDX spectra as shown in (c). (b) EDX element mappings of Y, Fe, and Si in the same nanoparticle and their merged picture. The first STEM image circles the detected particle (scale bar: 20 nm), and the second STEM image was obtained with an element mapping process (scale bar: 50 nm). (c) EDX spectra of spots A and B in (a), verifying that the two different types of nanocrystals are both embedded in the same MSNs.
Figure 3
Figure 3
Upconversion luminescence mechanism and the temperature conversion working curve. (a) Illustration of the upconversion mechanism. The Yb3+ ions absorb the 980 nm photons and transfer the energy to the Er3+ ions. After two sequential energy transfers, the excited Er3+ ions relax to the thermally coupled states 2H11/2 and 4S3/2 (via nonradiative decays) and transit back to the ground state, corresponding to the green emissions centered at 520 and 540 nm. (b) Illustration of peak fitting process in calculating the emission band intensities. The black curve is the collected spectrum, the green curves are the fitting peaks, and the red curve is the sum of all fitting peaks. The coefficient of determination for this fitting is 99.55%. (c) Emission spectra of UCNCs collected at different temperatures. (d) Linear working curve correlating the emission intensity ratios and the inverse temperatures for UCNC. I520 and I540 stand for the peak intensities in the luminescence spectra. The populations of states 2H11/2 and 4S3/2 follow the Boltzmann distribution. As the temperature increases, the 2H11/2 level gains more population, while the 4S3/2 level loses population, resulting in the increase in emission intensity ratio.
Figure 4
Figure 4
Nanoparticle temperature change under various experimental conditions. (a) Nanothermometer-detected temperature changes of UCNC@MS, UCNC:MNC5@MS, and UCNC:MNC20@MS with a 30, 60, and 90 s OMF exposure. The UCNC:MNC20@MS experiences more heating than the UCNC:MNC5@MS. The control sample UCNC@MS shows neither a significant temperature increase nor an exposure time dependency. The inset shows the temperature change in response to the exposure time for UCNC:MNC5@MS (red triangles) and UCNC:MNC20@MS (black squares) and their linear fittings. A proportional increase is observed as the exposure time increases. (b) Parallel study to (a), when the magnetic field induction power is reduced to half. (c) UCNC:MNC20@MS temperature change under variable OMF induction power. The 30 s (light blue triangles), 60 s (blue dots), and 90 s (dark blue squares) indicate the exposure time. A linear dependency is present because the magnetic field induction power is proportional to the heat dissipation power of the nanocrystals. (d) UCNC:MNC20@MS heating effect as a function of OMF exposure time. The temperature increase is linearly related to the exposure time initially (gray dashed line) and eventually saturates as the length approaches 5 min, as a result of the greater temperature gradient with the environment and the faster heat dissipation rate. Error bars are experimental standard deviations. See Supporting Information for error propagation analysis.
Figure 5
Figure 5
In situ nanoparticle temperature detection during and after exposure to the oscillating magnetic field. (a) Nanoparticle (red dots) and bulk solution (black squares) temperature changes during and after a 90 s OMF exposure. (b) Nanoparticle and bulk solution temperature changes during and after a 5 min OMF exposure. During the OMF exposure (gray area), the nanoparticle inside has a much higher heating rate than the bulk solution and the temperature gradient grows with time. At the end of the exposure, the nanoparticle temperature is about twice that of the solution. After the exposure, the nanoparticle temperature quickly decreases while the bulk solution slightly increased to equilibrate with the nanoparticles. Then the system gradually dissipates heat and recovers its initial state.

Similar articles

Cited by

References

    1. Rosensweig R. E. Heating Magnetic Fluid with Alternating Magnetic Field. J. Magn. Magn. Mater. 2002, 252, 370–374.
    1. Hergt R.; Dutz S.; Mueller R.; Zeisberger M. Magnetic Particle Hyperthermia: Nanoparticle Magnetism and Materials Development for Cancer Therapy. J. Phys.: Condens. Matter 2006, 18, S2919–S2934.
    1. Etheridge M. L.; Bischof J. C. Optimizing Magnetic Nanoparticle Based Thermal Therapies within the Physical Limits of Heating. Ann. Biomed. Eng. 2013, 41, 78–88. - PubMed
    1. Kim J.; Kim H. S.; Lee N.; Kim T.; Kim H.; Yu T.; Song I. C.; Moon W. K.; Hyeon T. Multifunctional Uniform Nanoparticles Composed of a Magnetite Nanocrystal Core and a Mesoporous Silica Shell for Magnetic Resonance and Fluorescence Imaging and for Drug Delivery. Angew. Chem., Int. Ed. 2008, 47, 8438–8441. - PubMed
    1. Lu A.-H.; Salabas E. L.; Schueth F. Magnetic Nanoparticles: Synthesis, Protection, Functionalization, and Application. Angew. Chem., Int. Ed. 2007, 46, 1222–1244. - PubMed

Publication types

LinkOut - more resources