. 2014 Jul 1;74(13):3441-53.
doi: 10.1158/0008-5472.CAN-13-3596. Epub 2014 Apr 29.

Immunosuppressive myeloid cells induced by chemotherapy attenuate antitumor CD4+ T-cell responses through the PD-1-PD-L1 axis

Affiliations

Immunosuppressive myeloid cells induced by chemotherapy attenuate antitumor CD4+ T-cell responses through the PD-1-PD-L1 axis

Zhi-Chun Ding et al. Cancer Res. .

Abstract

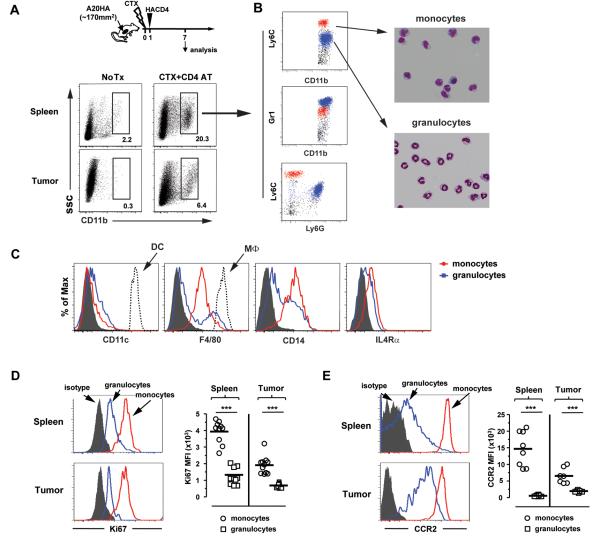
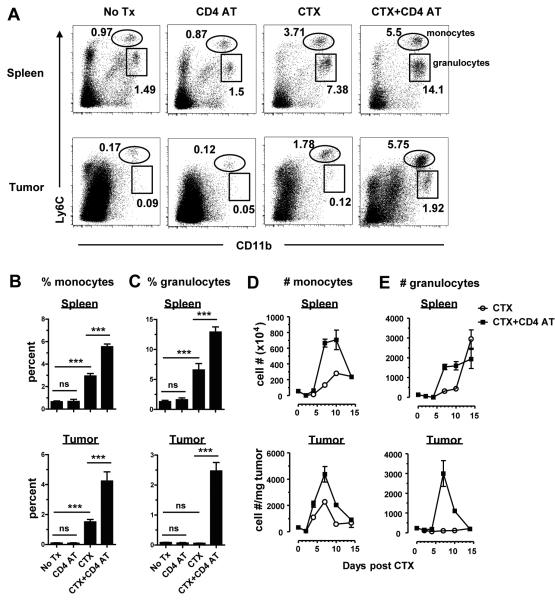
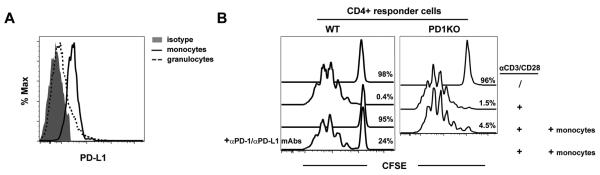
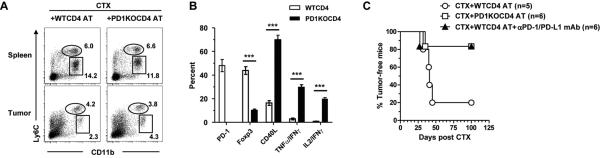
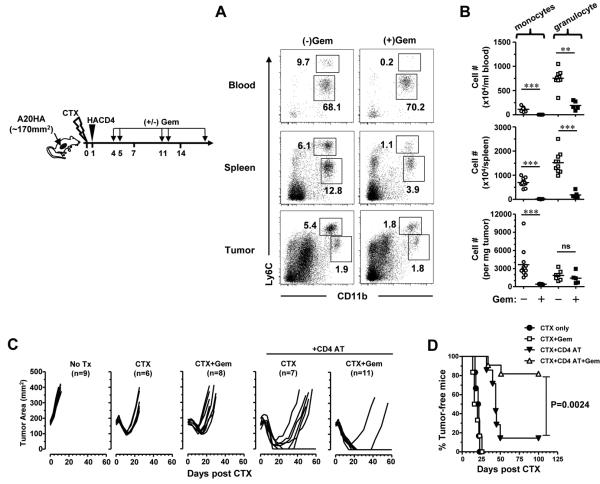
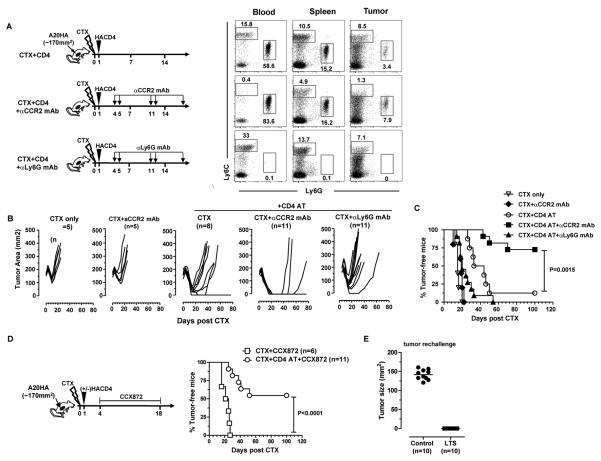
In recent years, immune-based therapies have become an increasingly attractive treatment option for patients with cancer. Cancer immunotherapy is often used in combination with conventional chemotherapy for synergistic effects. The alkylating agent cyclophosphamide (CTX) has been included in various chemoimmunotherapy regimens because of its well-known immunostimulatory effects. Paradoxically, cyclophosphamide can also induce suppressor cells that inhibit immune responses. However, the identity and biologic relevance of these suppressor cells are poorly defined. Here we report that cyclophosphamide treatment drives the expansion of inflammatory monocytic myeloid cells (CD11b(+)Ly6C(hi)CCR2(hi)) that possess immunosuppressive activities. In mice with advanced lymphoma, adoptive transfer (AT) of tumor-specific CD4(+) T cells following cyclophosphamide treatment (CTX+CD4 AT) provoked a robust initial antitumor immune response, but also resulted in enhanced expansion of monocytic myeloid cells. These therapy-induced monocytes inhibited long-term tumor control and allowed subsequent relapse by mediating functional tolerization of antitumor CD4(+) effector cells through the PD-1-PD-L1 axis. PD-1/PD-L1 blockade after CTX+CD4 AT therapy led to persistence of CD4(+) effector cells and durable antitumor effects. Depleting proliferative monocytes by administering low-dose gemcitabine effectively prevented tumor recurrence after CTX+CD4 AT therapy. Similarly, targeting inflammatory monocytes by disrupting the CCR2 signaling pathway markedly potentiated the efficacy of cyclophosphamide-based therapy. Besides cyclophosphamide, we found that melphalan and doxorubicin can also induce monocytic myeloid suppressor cells. These findings reveal a counter-regulation mechanism elicited by certain chemotherapeutic agents and highlight the importance of overcoming this barrier to prevent late tumor relapse after chemoimmunotherapy.


Figures

Figure 1
Figure 1
CTX+CD4 AT therapy induces inflammatory myeloid cells consisting of monocytic and granulocytic subsets. A20HA tumors were subcutaneously inoculated to mice. When tumor sizes reached ~170 mm2, mice were either untreated (No Tx), or treated with CTX followed by adoptive transfer of HA-specific CD4+ T cells (CTX+CD4 AT). 7 days after CTX treatment, spleens and tumor masses were processed for analyses. A, Representative dot plots showing the frequencies of CD11b+ myeloid cells. The numbers represent the percentages of the gated CD11b+ population in total live cells. B, Co-expression pattern of myeloid lineage markers and Giemsa stain. Spleen cells from treated mice were co-stained for CD11b, Gr1, Ly6C and Ly6G. Gating on CD11b+ cells, representative dot plots show the co-expression profiles of CD11b vs. Ly6C, CD11b vs. Gr1, and Ly6C vs. Ly6G, respectively. The two major subpopulations were color-matched using the FACSDiva software.). Cells were sorted into CD11b+Ly6Chi and CD11b+Ly6Clo subsets, and stained with Giemsa solution (right panel). Images shown (x100 magnification) are representative of three independent experiments. C, Phenotype comparison between the two myeloid subsets. Gating on monocytic or granulocytic myeloid subsets, expression profiles of CD11c, F4/80, CD14 and IL4Rα are shown in histograms. Conventional DCs and macrophages are included for comparison of the expression levels of CD11c and F4/80, respectively. C–D, Expression profiles of Ki67 and CCR2 in therapy-induced myeloid cells. Spleen and tumor samples from treated mice were stained for CD11b and Ly6C, and evaluated for Ki67 (C) and CCR2 (D) expression profiles in each myeloid cell subset. Representative histograms of Ki67 and CCR2 expressions are shown. Scatter plots summarize the medium fluorescence intensity (MFI). Data are pooled from 3 independent experiments. ***, P<0.001.
Figure 2
Figure 2
CTX-driven myeloid cell expansion is amplified by antitumor CD4+ effector cells. Following the experimental time line depicted in Fig. 1A, mice with established tumors were randomly divided into 4 groups and received the specified treatment. A, Frequencies of myeloid cells in spleens and tumors. 7 days after CTX treatment, spleens and tumor masses were processed for FACS analyses. Representative dot plots are shown for co-staining of Ly6C and CD11b. Numbers in dot plots represent frequencies of the gated populations. The results are summarized in bar graphs for monocytes (B) and granulocytes (C). Data pooled from three independent experiments are shown as mean ± SD. ***, P<0.001. D–E, Kinetics of monocytic (D) and granulocytic (E) myeloid cell expansion after CTX in the presence or absence of tumor-specific CD4+ T cells. Tumor-bearing mice were treated as indicated. At the indicated time points, spleen cells were enumerated and analyzed for CD11b and Ly6C expressions by FACS. Tumor masses were weighed before being processed for FACS-based cell counting and phenotypic analysis. The numbers of myeloid cells are shown as mean ± SD with at least 5 samples at each time point. The formula for cell number calculation is: total cell number × percent of specific myeloid subset. Cell number in tumor is normalized to the weight of tumor mass.
Figure 3
Figure 3
Therapy-induced monocytes possess immunosuppressive activities. Following the experimental procedures depicted in Fig. 1A, tumor-bearing mice were treated with CTX+CD4 AT. A, In vitro suppression assays measuring CD4+ T-cell proliferation by CFSE dilution. 7 days after CTX-treatment, monocytes (CD11b+Ly6Chi) and granulocytes (CD11b+Ly6Clo) were FACS-sorted from spleen cells. Spleen cells from HA-TCR Tg or normal Balb/c mice were labeled with CFSE and used as responder cells. Responder cells were mixed with the indicated numbers of sorted myeloid cells, and stimulated with αCD3 and αCD28 mAbs. After 3 days in culture, cells were stained for CD4 and analyzed by FACS. Proliferation of CD4+ responder cells was evaluated by CFSE dilution. Percent of undivided cells under each condition is given in histogram. Asteroid (*) marks a 1:1 ratio between the responder cells and the sorted myeloid cells. B, Immune suppression mediated by tumor-infiltrating monocytes. Monocytes and granulocytes were sorted from the tumor masses of mice receiving CTX+CD4 AT therapy. Responder cells were mixed with equal numbers of sorted myeloid cells and stimulated with αCD3/αCD28 mAbs. The proliferation status of CD4+ responder cells was evaluated by CFSE dilution. C, Kinetics of myeloid cell recovery in the spleens of tumor-free mice after CTX treatment. Naïve Balb/c mice were treated with a single dose of CTX. At the indicated time points, spleen cells were enumerated and stained for CD11b and Ly6C to determine the frequency and absolute number of each myeloid cell subset. Results are shown as mean ±SD of 4 mice each group. D, In vitro suppression assay using myeloid cells from CTX-treated or untreated tumor-free mice. Naïve Balb/c mice were treated or not treated with CTX. 7 days later, monocytic (CD11b+Ly6Chi) and granulocytic (CD11b+Ly6Clo) myeloid cells were sorted from the spleens. In vitro suppression culture was setup as described in (A). Equal numbers of responder cells and sorted myeloid cells were used. Proliferation of CD4+ responder cells was evaluated by CFSE dilution. Results shown are representative of 3 independent experiments.
Figure 4
Figure 4
Therapy-induced monocytes inhibit CD4+ T-cell activation through the PD-1/PD-L1 axis. A, PD-L1 expression in inflammatory monocytes. Spleen cells from mice treated with CTX+CD4 AT therapy were stained for CD11b and Ly6C. Expression profiles of PD-L1 in monocytes and granulocytes are shown. B, Disruption of the PD-1 pathway abolishes monocyte-mediated suppression on CD4+ responder cells. Monocytes were sorted from the spleens of mice that had been treated with CTX+CD4 AT. In the left panel, splenocytes from PD-1-sufficient (WT) HA-TCR Tg mice were used as responder cells. CFSE-labeled responder cells were mixed with equal numbers of sorted monocytes. To block PD-1/PD-L1 interaction, a cocktail of αPD-1 and αPD-L1 mAbs was added to culture. In the right panel, splenocytes from PD-1-deficient (PD1KO) HA-TCR Tg mice were used as responder cells. The proliferation status of CD4+ responder cells was evaluated by CFSE dilution. Results shown are representative of 3 independent experiments.
Figure 5
Figure 5
Disrupting the PD-1/PD-L1 axis after CTX+CD4 AT therapy leads to persistence of CD4+ effector cells and durable antitumor effects. Mice with established A20HA tumors (~170 mm2) were treated with CTX followed by adoptive transfer of either PD-1-sufficient (WT) or PD-1-deficient (PD1KO) HA-specific CD4+ T cells the next day. A, Frequencies of myeloid cell subsets in mice receiving WT or PD1KO CD4+ T cells after CTX. 7 days after CTX-treatment, several mice from each group were killed to collect spleen and tumor samples for FACS analysis. Representative dot plots are shown, and the numbers represent the percentages of the gated population. B, Phenotypic analysis of donor CD4+ T cells. 30 days after CTX, spleens were isolated from symptom-free mice that had received PD1KO HA-specific CD4+ T cells, or from relapsed mice that had received WT HA-specific CD4+ T cells. Spleen cells were stained for CD4 and Thy1.1 to identify the donor CD4+ T cells, and evaluated for expressions of PD-1, Foxp3 and CD40L by FACS. Cytokine expression in donor CD4+ T cells were assayed by intracellular cytokine staining (ICS) after a 4hr stimulation with the cognate peptide. The results of all samples are summarized in bar graph. Data are shown as mean ± SD with at least 3 samples per group. ***, P<0.001. C, Overall survival of mice receiving WT or PD1KO HA-specific CD4+ T cells after CTX is shown as Kaplan-Meier survival curve indicating the percentage of tumor-free mice as a function of time after CTX treatment. Some mice receiving CTX+WTCD4 AT therapy were subsequently injected with αPD-1 and αPD-L1 mAbs. The number of mice in each group is given.
Figure 6
Figure 6
Low dose gemcitabine reduces inflammatory monocytes and potentiates the efficacy of CTX+CD4 AT therapy. Following the timeline depicted in the schema, mice with established A20HA tumors were treated with CTX+CD4 AT. A cohort of mice received additional Gem treatment following the specified schedule. Other controls include mice receiving no treatment, CTX only, and the combination of CTX and Gem. A, Effect of Gem on myeloid cell frequencies. Several mice from the indicated groups were sacrificed on day 7, and peripheral blood, spleen and tumor samples were collected for FACS analyses. Representative dot plots are shown, and the numbers represent the frequencies of the gated populations. B, Summary of the numbers of each myeloid cell subset in mice receiving or not receiving Gem treatment after CTX+CD4 AT. The numbers of myeloid cells in blood and tumor are normalized to the volume of blood and the weight of tumor mass, respectively. The remaining mice were monitored for tumor growth kinetics (C) and overall survival (D). The number of mice in each group is given. **, P<0.01. ***, P<0.001.
Figure 7
Figure 7
Disrupting the CCL2-CCR2 axis after CTX+CD4 AT therapy leads to targeted depletion of inflammatory monocytes and prevention of relapse. Following the timeline depicted in the schema, mice with established A20HA tumors were treated with CTX+CD4 AT. At the indicated time points, a cohort of mice were injected with CCR2-specific mAb (MC21), and some mice were given Ly6G-specific mAb (1A8). As controls, some tumor-bearing mice were treated with CTX only, or the combination of CTX and αCCR2 mAb. A, Selective depletion of myeloid cell subset by specific mAbs. On day 7, 2–3 mice from the indicated groups were killed and peripheral blood, spleen and tumor samples were collected for FACS analysis to document the Ab depletion effects. Representative dot plots are shown. Numbers represent the percentages of the gated populations. The remaining mice were monitored for tumor growth kinetics (B) and overall survival (C). D, Administration of CCR2 inhibitor CCX872 reduces relapse after CTX+CD4 AT therapy. The treatment procedures are depicted in the schema, and mouse survival curve is shown. E, Long-term survivors (LTS) are resistant to tumor re-challenge. Tumor-bearing mice received CTX+CD4 AT therapy, followed by low dose Gem, or CCR2-specific mAb (MC21). Mice that had complete tumor regression and stayed symptom-free for over 90 day after the initial CTX treatment were considered as LTS. LTS were re-challenged with A20HA tumors on the flank opposite to the initial tumor inoculation site. As controls, naïve mice were inoculated with A20HA tumors. The number of mice in each group is given. The LTS group contained 6 Gem-treated mice and 4 MC21-treated mice.

References

    1. Mellman I, Coukos G, Dranoff G. Cancer immunotherapy comes of age. Nature. 2011;480:480–489. - PMC - PubMed
    1. Zou W. Immunosuppressive networks in the tumour environment and their therapeutic relevance. Nat Rev Cancer. 2005;5:263–274. - PubMed
    1. Zitvogel L, Apetoh L, Ghiringhelli F, Kroemer G. Immunological aspects of cancer chemotherapy. Nat Rev Immunol. 2008;8:59–73. - PubMed
    1. Sistigu A, Viaud S, Chaput N, Bracci L, Proietti E, Zitvogel L. Immunomodulatory effects of cyclophosphamide and implementations for vaccine design. Semin Immunopathol. 2011;33:369–383. - PubMed
    1. Proietti E, Moschella F, Capone I, Belardelli F. Exploitation of the propulsive force of chemotherapy for improving the response to cancer immunotherapy. Mol Oncol. 2012;6:1–14. - PMC - PubMed

Publication types

MeSH terms