. 2014 Apr 29;4(4):e387.
doi: 10.1038/tp.2014.28.

Pavlovian conditioning and cross-sensitization studies raise challenges to the hypothesis that overeating is an addictive behavior

Affiliations

Pavlovian conditioning and cross-sensitization studies raise challenges to the hypothesis that overeating is an addictive behavior

M R Harb et al. Transl Psychiatry. .

Abstract

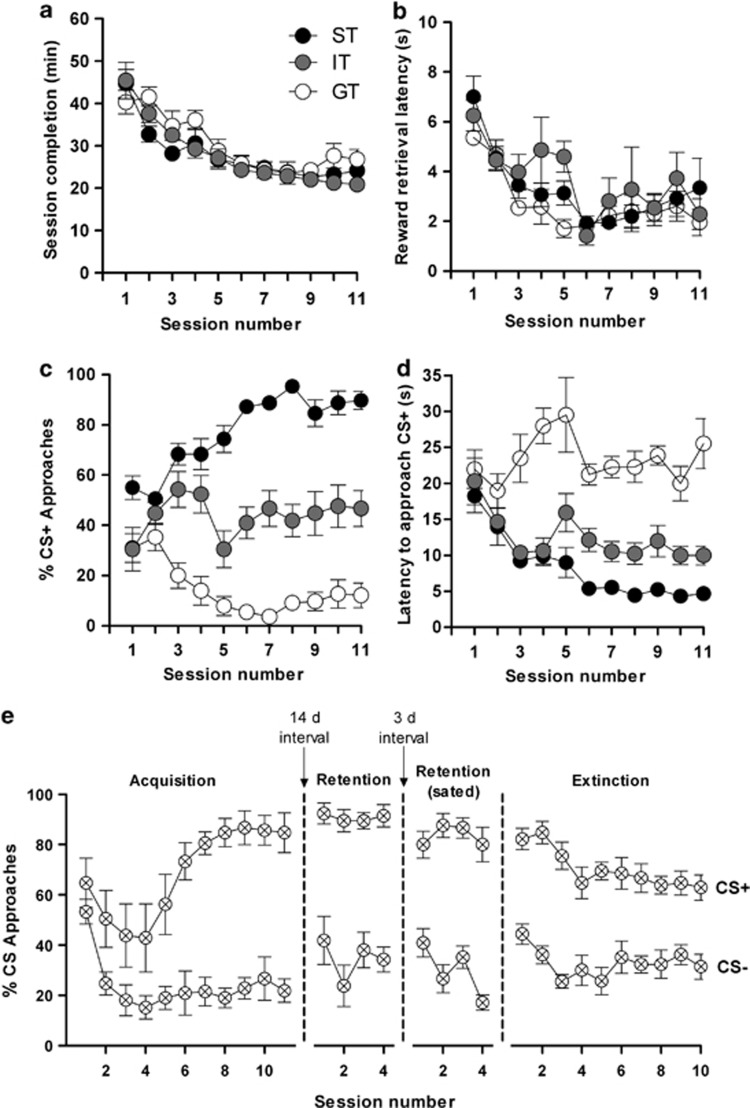
Elevated glucocorticoid levels and sign tracking (ST) in Pavlovian conditioning are potential biomarkers of compulsive behaviors such as addiction. As overeating is sometimes viewed as a form of addictive behavior, we hypothesized that murine Pavlovian sign trackers would have a greater propensity to overeat and develop obesity. Using a food reward in the classical conditioning paradigm, we show that ST behavior is a robust conditioned response but not a predictor of eating and growth trajectories in mice, thus challenging the view that the development of obesity and drug addiction depend on identical mechanisms. This interpretation was supported by experiments which showed that overweight mice do not display cross-sensitization to an addictive drug (morphine), and conversely, that overweight morphine-sensitized animals do not overconsume a highly rewarding food. Although the rewarding/motivational effects of both food and drugs of abuse are mediated by similar neurochemical mechanisms, obesity and drug addiction represent a summation of other dysfunctional input and output pathways that lead to the emergence of two distinct disorders, each of which would deserve a specific pharmacotherapeutic approach.


Figures

Figure 1
Figure 1
Acquisition of conditioned responses. Mice displayed different conditioned responses, sign-tracking (ST, predominantly approached the CS+ n=13), goal-tracking (GT, predominantly approached the US; n=11) and intermediate-tracking (IT, alternated between CS+ and US with approximately equal frequency; n=7). Autoshaping was monitored over 11 sessions; in each session, mice received 15 CS+ and 15 CS− presentations. (a) Time (min) for completion of session. (b) Mean latency (s) to retrieve the food reward. (c) Relative number of CS+ approaches during each session. (d) Mean latency (s) to approach the CS+ during each session. (e) Results derive from a cohort of ST mice (n=7) different to that used in upper panels (ad). Left-most panel shows acquisition of the task (11 sessions). After a 14-day interval, mice were tested for retention of their conditioned responses under standard testing conditions involving food restriction (second-from-left panel) and, following a 3-day interval, retention was tested when mice were fed ad libitum (second-from-left panel). The left-most panel depicts results of an experiment to test extinction of the conditioned response; over 10 consecutive sessions. Data shown are means±s.e.m. CS, conditioned stimulus; US, unconditioned stimulus.
Figure 2
Figure 2
Conditioned responses do not shift with changes in reward value. Shown are the approaches to the CS+ in each of the 11 test sessions consisting of 15 CS+ and 15 CS− presentations. (a) Mice rewarded with a high-fat reward segregated into sign trackers (ST; n=9), goal-trackers (GT; n=8) and intermediate trackers (IT; n=5). (b) Mice rewarded with a low-fat liquid reward segregated into sign trackers (ST; n=8), goal-trackers (GT; n=7) and intermediate trackers (IT; n=9). Acquisition of ST, GT and IT conditioned responses to high-fat or low-fat rewards is shown in (c, d and e), respectively. Data are presented as means±s.e.m. CS, conditioned stimulus.
Figure 3
Figure 3
(ad) Stress-coping and emotional phenotype in sign-tracking (ST), goal-tracking (GT) and intermediate-tracking (IT) mice. Tests were performed in ST (n=13), GT (n=11) and IT (n=7) mice. (a) Serum corticosterone levels in mice under basal conditions (0 min after stress) and 30 and 120 min following an acute stressor (see Materials and Methods for experimental details) are depicted. Note that although ST mice showed the most robust hormonal response to the stressor, all animals had similar levels of corticosterone 120 min post stress, indicating that glucocorticoid negative feedback mechanisms were unimpaired in the ST group. (bc) Locomotor activity was monitored in an open field arena. Two parameters were monitored: total distance traveled (m) and time spent in the center of the arena during a 5-min test period. (d) The novel object test was used to assess emotionality in terms of time spent exploring an unfamiliar object placed in the center of an open field arena. Interactions of ST, GT and IT mice with the novel object were monitored over 5 min. (e) Stress-coping behavior in ST, GT and IT mice was compared in a one-session forced-swim test. All groups of mice showed similar times spent floating, that is, showed identical stress-coping capacities. The depicted data are means±s.e.m; the asterisk indicates a higher value in ST (P<0.05), compared with GT and IT. (fh) Motivation for food reward does not differ between ST, GT and IT mice. Animals were rewarded with sweetened milk, considered to be more rewarding than their standard food pellets. Shown are the mean latency to approach the reward (f), the time taken to retrieve (and consume) the food reward (g), and the number of food-tray entries (h) by ST, GT and IT mice. Measurements were made over two sessions, with 15 reward deliveries in each. The results are shown as means±s.e.m.
Figure 4
Figure 4
Patterns of consumption and body mass growth curves in sign-tracking (ST), goal-tracking (GT) and intermediate-tracking (IT) mice maintained on a high-fat diet (HFD). Sign-trackers (ST; n=13), goal-trackers (GT; n=11) and intermediate trackers (IT; n=7) were placed on a highly palatable high-fat diet, available ad libitum, for a period of 3 months. The consumption of the HFD was similar in all groups during the first 6 days of exposure to the HFD (a); note that groups did not differ in their initial body masses (inset) and showed similar gains in body mass over the 3-month duration of the experiment (b). The data shown are means±s.e.m.
Figure 5
Figure 5
(a) Morphine cross-sensitization in overweight mice. The experiment was carried out in mice of varying degrees of overweight/obesity through maintenance on normal chow (NC, n=15), LFD (n=16) and HFD (n=16); the experimental design is shown schematically in the upper panel. Initial body masses of the different groups are shown in the inset. Animals were habituated over 3 days to the experimental procedure through handling by the experimenter and injection of saline intraperitoneally (0.2 ml); mice were then introduced into the open field (OF) test arena (5 min per day; arena specifications and test conditions are described in the legend to Figure 3). Following habituation, animals received intraperitoneal injections of either saline or morphine (20 mg kg−1) and returned to their home cages for 20 min before placement in the OF for 10 min during which time their locomotor activity was recorded. After a 3-week interval, mice were given four consecutive intraperitoneal injections of morphine (20 mg kg−1 per day) or vehicle and kept morphine-free (withdrawn) for 4 days before administration of an acute injection of morphine (20 mg kg−1) or saline, after which they were returned to their home cages (20 min) and then monitored for locomotor activity in the OF for over 10 min; video recordings of the latter were evaluated using ANY-maze software. Results obtained after the acute injections are shown in the left-hand panel, those after repeated morphine or saline injections are depicted in the right-hand panel. Data are shown as means±s.e.m. (bc) Sucrose consumption test in morphine-sensitized mice in differing states of obesity. Experiments were performed in animals that were maintained on either LFD or HFD and some of which were sensitized to morphine (LFD-saline, n=8; LFD-morphine, n=8; HFD-saline, n=7; HFD-morphine, n=7). Animals were provided with solution of water and 5% sucrose; intake of sucrose was monitored at intervals over a period of 24 h, when mice were satiated (ad libitum food) (b) or food-deprived for 24 h (c). Depicted data are means±s.e.m. HFD, high-fat diet; LFD, low-fat diet.

Similar articles

Cited by

References

    1. Kivimäki M, Lawlor DA, Singh-Manoux A, Batty GD, Ferrie JE, Shipley MJ, et al. Common mental disorder and obesity: insight from four repeat measures over 19 years: prospective Whitehall II cohort study. BMJ. 2009;339:b3765. - PMC - PubMed
    1. Scott KM, McGee MA, Wells JE, Oakley Browne MA. Obesity and mental disorders in the adult general population. J Psychosom Res. 2008;64:97–105. - PubMed
    1. Allison DB, Newcomer JW, Dunn AL, Blumenthal JA, Fabricatore AN, Daumit GL, et al. Obesity among those with mental disorders: a National Institute of Mental Health meeting report. Am J Prev Med. 2009;36:341–350. - PubMed
    1. Cohen DA. Neurophysiological pathways to obesity: below awareness and beyond individual control. Diabetes. 2008;57:1768–1773. - PMC - PubMed
    1. Martin-Soelch C, Linthicum J, Ernst M. Appetitive conditioning: neural bases and implications for psychopathology. Neurosci Biobehav Rev. 2007;31:426–440. - PMC - PubMed

Publication types