. 2014 Apr 29;3(4):e159.
doi: 10.1038/mtna.2014.9.

Silencing VDAC1 Expression by siRNA Inhibits Cancer Cell Proliferation and Tumor Growth In Vivo

Affiliations

Silencing VDAC1 Expression by siRNA Inhibits Cancer Cell Proliferation and Tumor Growth In Vivo

Tasleem Arif et al. Mol Ther Nucleic Acids. .

Erratum in

Abstract

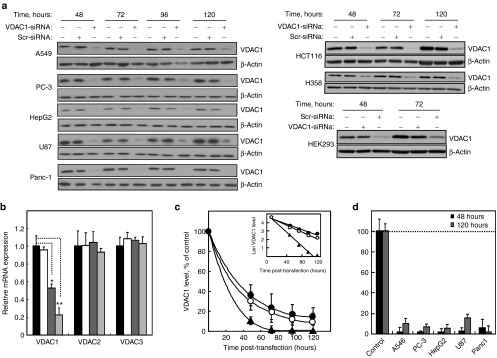
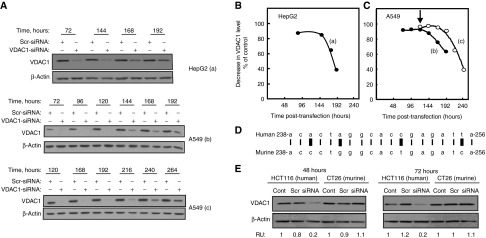
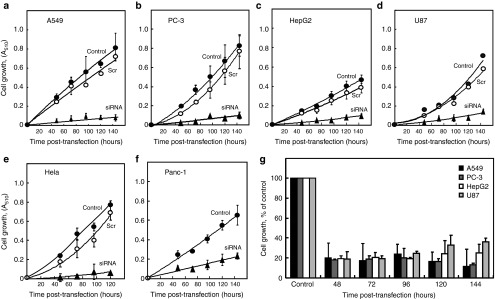
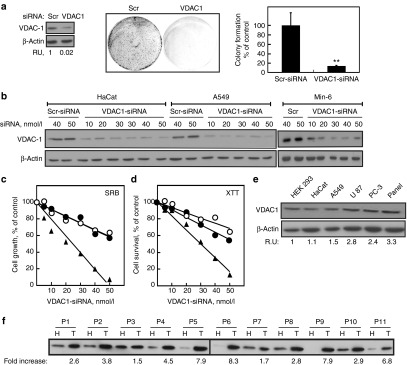
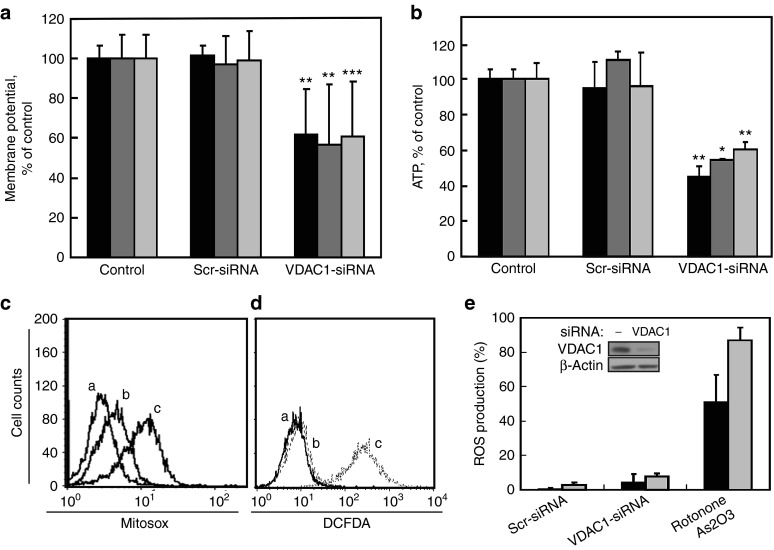
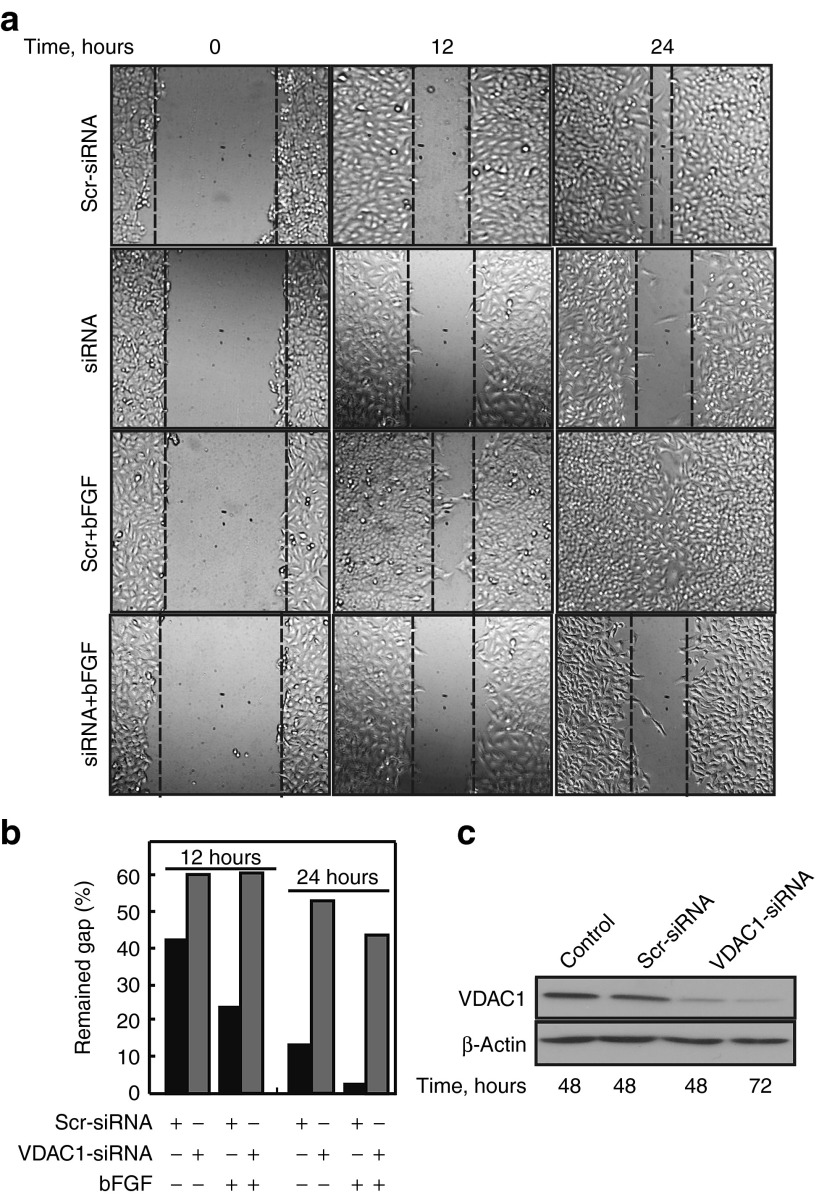
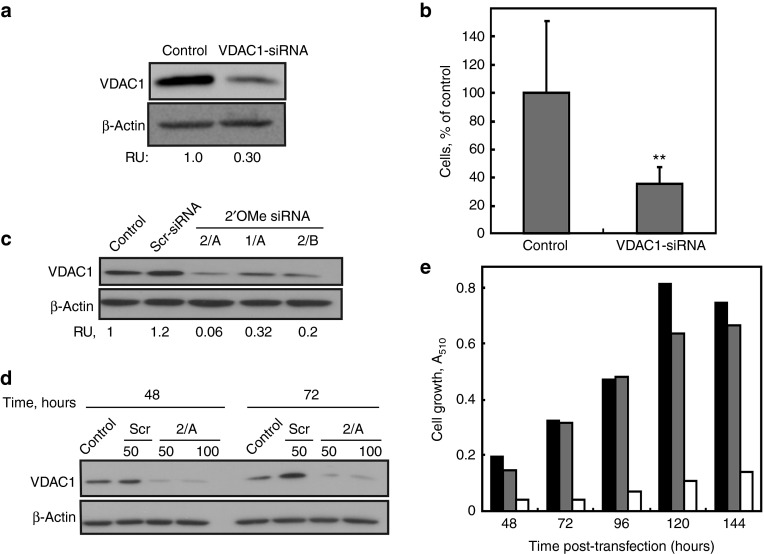
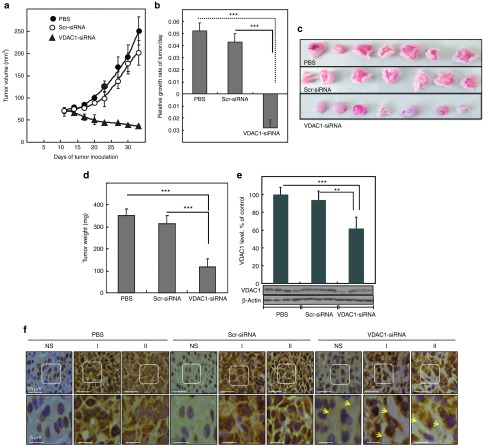
Alterations in cellular metabolism and bioenergetics are vital for cancer cell growth and motility. Here, the role of the mitochondrial protein voltage-dependent anion channel (VDAC1), a master gatekeeper regulating the flux of metabolites and ions between mitochondria and the cytoplasm, in regulating the growth of several cancer cell lines was investigated by silencing VDAC1 expression using small interfering RNA (siRNA). A single siRNA specific to the human VDAC1 sequence at nanomolar concentrations led to some 90% decrease in VDAC1 levels in the lung A549 and H358, prostate PC-3, colon HCT116, glioblastoma U87, liver HepG2, and pancreas Panc-1 cancer cell lines. VDAC1 silencing persisted 144 hours post-transfection and resulted in profound inhibition of cell growth in cancer but not in noncancerous cells, with up to 90% inhibition being observed over 5 days that was prolonged by a second transfection. Cells expressing low VDAC1 levels showed decreased mitochondrial membrane potential and adenoside triphosphate (ATP) levels, suggesting limited metabolite exchange between mitochondria and cytosol. Moreover, cells silenced for VDAC1 expression showed decreased migration, even in the presence of the wound healing accelerator basic fibroblast growth factor (bFGF). VDAC1-siRNA inhibited cancer cell growth in a Matrigel-based assay in host nude mice. Finally, in a xenograft lung cancer mouse model, chemically modified VDAC1-siRNA not only inhibited tumor growth but also resulted in tumor regression. This study thus shows that VDAC1 silencing by means of RNA interference (RNAi) dramatically inhibits cancer cell growth and tumor development by disabling the abnormal metabolic behavior of cancer cells, potentially paving the way for a more effective pipeline of anticancer drugs.


Figures

Figure 1
Figure 1
hVDAC1-siRNA-silenced VDAC1 expression in various cancer cell lines. In (a), several cancer cell lines were either not transfected (control) or transfected with scrambled (Scr-siRNA) or VDAC1-specific siRNA (VDAC1-siRNA) and analyzed for VDAC1 expression at the indicated times post-transfection using anti-VDAC1 antibodies. Cells transfection was carried out using 50 nmol/l siRNA and the following transfection reagents: HCT116 and HEK-293 cells were transfected using DharmaFect, H358 and A549 cells and PC-3, Panc-1, U-87, and HeLa cells were transfecting using Jet Prime, while HepG2 cells were transfected using INTERFERin. In (b), qPCR analysis of mRNA isolated from A549 cells not treated (black bars) or treated with 50 nmol/l scrambled-siRNA (white bars) or with VDAC1-siRNA, 25 nmol/l (dark gray bars) or 50 nmol/l (light gray bars). VDAC1, VDAC2, and VDAC3 levels were analyzed using specific primers and probes as described in Materials and Methods. In (c), Densitometric quantitative analysis of the immunoblot was carried out and presented (relative units (RU)) for all cell lines 48 and 120 hours post-transfection (n = 3). In (d), showing that VDAC1 expression levels were reduced by about 90%. This decrease persisted for up to 120 hours post-transfection. The decreases in voltage-dependent anion channel (VDAC) levels as function of time post-transfection for three cell lines (n = 3), with the inset showing analysis of half-life time (t1/2) of VDAC1-silencing, are presented.
Figure 2
Figure 2
Time course of small interfering RNA (siRNA)-silencing of voltage-dependent anion channel (VDAC1) expression and its specificity for human VDAC1. (A) HepG2 (a) and A549 (b, c) cells were transfected with scrambled (Scr) or VDAC1-siRNA (siRNA) (50 nmol/l), and VDAC1 levels were analyzed at the indicated times. Quantitative analysis representing the decrease in VDAC1 levels as a function of the time post-transfection in HepG2 (b) and A549 (c) cells is presented. In C, cells were divided into two groups 120 hours post-transfection (b and c), with cells in (c) being subjected to a second transfection with VDAC1-siRNA (50 nmol/l). VDAC1 levels were analyzed in each case. Quantitation of the results is presented in C. In D, sequences of the human and murine VDAC1 siRNA, differing by four nucleotides (indicated by rectangles), are shown. In E, human HCT-116 and murine CT26 colon carcinoma cells were transfected with hVDAC1-siRNA and VDAC1 expression was analyzed 48 and 72 hours post-transfection. Quantitative densitometric analysis is presented as relative units (RU).
Figure 3
Figure 3
Effect of voltage-dependent anion channel (VDAC1)-silencing on cell growth. Cell growth of the A549 (a), PC-3 (b), HepG2 (c), U-87 (d), HeLa (e), and Panc-1 (f) cell lines was assayed using the sulforhodamine B (SRB) cell proliferation assay, presented as absorbance at 510 nm. Cells were nontransfected (control) (•) or transfected with scrambled (Scr) (o) or VDAC1-siRNA (siRNA) (s) (50 nmol/l), and cell amounts were analyzed at the indicated times (48–144 hours) post-transfection. Cell growth at 48, 72, 96, 120, and 144 hours post-transfection with VDAC1-siRNA is presented as a percent of the cell growth attained by scrambled small interfering RNA (siRNA)-transfected cells (g) (n = 3).
Figure 4
Figure 4
Cell proliferation and growth of cancer cells expressing highly levels of voltage-dependent anion channel (VDAC1) are highly inhibited by VDAC1-siRNA. A549 (a) cells were transfected with scrambled (Scr) or hVDAC1-small interfering RNA (siRNA) (VDAC1) and were analyzed for VDAC1 expression levels 96 hours post-transfection (a, left panel). The relative amount (RU) of VDAC1 in the treated cells, in comparison to controls, is presented. Colony formation analysis of controls and VDAC1-silenced cells (a, center panel) was carried out as described in Material and Methods. Quantitative analysis of colonies (a, right panel) is presented as means ± SEM (**P < 0.01; n = 3). In b, A549 and immortal human keratinocyte HaCat and pancreatic (MIN-6) cell lines were transfected with scrambled or VDAC1-siRNA, and 48 hours post-transfection, the cell lines were analyzed for VDAC1 expression levels by immunblot (b), and cell growth of A549 (s), HaCat (O) and Min-6 (•)using sulforhodamine B (c) or XTT (d). In e, the levels of VDAC1 in several cancer cell lines, relative to such levels in noncancerous HEK cells, are presented. In f, samples of healthy (H) and tumor (T) tissues, each taken from the same lung of a lung cancer patient, were obtained and prepared for sodium dodecyl sulfate–polyacrylamide gel electrophoresis (SDS–PAGE) and immunoblot, as described in the Materials and Methods section. The fold increase in VDAC1 expression represents the increase in VDAC1 level in the tumor in comparison to the healthy tissue, both from the same patient. As actin levels differed in healthy and tumor tissues, we did not use actin as a loading control. However, the same protein amounts were loaded, as evaluated by protein determination using the Lowery method and by SDS–PAGE, Commassie blue staining and quantitative analysis of proteins band intensity.
Figure 5
Figure 5
Decreased mitochondrial membrane potential and cellular ATP levels in cells silenced for voltage-dependent anion channel (VDAC1) expression. HepG2 (black bars), A549 (dark grey), and PC-3 (grey) cells were untreated (control) or treated with scrambled or VDAC1-small interfering RNA (siRNA) and analyzed for mitochondrial ΔΨ with tetramethylrhodamine methylester (TMRM) (a), or for ATP cellular levels HepG2 (black bars), A549 (dark gray), and PC-3 (gray) (b), as described in Materials and Methods. Values represent means ± SEM (n = 3). Mitochondrial and cytosolic reactive oxygen species levels in A549 cells treated with scrambled- or VDAC1-siRNA were analyzed (c, d) as described in the Materials and Method section. To validate the assays, control cells were also treated with rotenone (10 µm, 16 hours) or As2O3 (80 µm, 16 hours). The results of fluorescence-activated cell sorting analysis (a representative experiment is shown in c and d) with mean ± SEM (n = 3) are presented (e), as well as the VDAC1 level in scrambled- and VDAC1-siRNA-treated cell is presented (inset, e).
Figure 6
Figure 6
The effect of voltage-dependent anion channel (VDAC1) deletion on cancer cell migration. A549 (a) cells were treated with scrambled or VDAC1-small interfering RNA (siRNA) and allowed to grow to 80% confluency (72 hours). The semiconfluent cell layer was scraped using a 200-µl sterile pipette tip to create a scratch/wound devoid of cells. Where indicated, cells were treated with basic fibroblast growth factor (20 µg/ml). Migration was assessed at 12 and 24 hours after treatment (60 and 72 hours post-transfection), as evaluated by the wound-healing assay. Representative photomicrographs are shown. (b) Quantification of the results describes the change in percentage of the scratch size at the indicated times. Data shown represent means ± SEM (n =3). **P < 0.01, treated versus control. (c) The level of VDAC1 in control cells and in cells transfected with scrambled or VDAC1-siRNA is presented.
Figure 7
Figure 7
Unmodified and modified hVDAC1-siRNA inhibition of cell growth in vitro and in vivo in Matrigel plug implants placed in nude mice. HepG2 cells were untreated or transfected with hVDAC1-siRNA (50 nmol/l) and their growth was tested in vivo using the Matrigel plug assay. DiD-labeled cells were inoculated into nude mice s.c., which were then provided with bromodeoxyuridine-containing water. After 5 days, the plugs were removed and sequentially analyzed for (a) voltage-dependent anion channel (VDAC1) expression levels and (b) cell proliferation. Cell growth was reduced by 65% in VDAC1-siRNA-transfected cells (n = 12), as compared to control cells (n = 9). The results represent means ± SEM, **P < 0.01 for hVDAC1-siRNA-transfected cells, as compared with control mice. In c, A549 cells were transfected with 50 nmol/l modified 1/A-, 2/A-, and 2/B-siRNA-hVDAC1 or scrambled small interfering RNA (siRNA). Fourty-eight hours post-transfection, the cells were harvested, lysed, and VDAC1 expression level was evaluated by immunoblot. Densitometric quantification analysis is presented as relative units (RU). A549 cells were untransfected or transfected with scrambled or 2/A-VDAC1-siRNA (50 or 100 nmol/l) and VDAC1 expression levels (d) and cell growth, assayed using (e) the sulforhodamine B (SRB) method, were assessed 48 and 72 hours or 96, 120, and 144 hours post-transfection, respectively. Black, grey, and white bars represent untransfected, transfected with scrambled or hVDAC1-siRNA cells, respectively (n = 2).
Figure 8
Figure 8
hVDAC1-siRNA inhibits tumor growth and regresses lung cancer xenografts. A549 cells were inoculated into male nude mice (7 × 106 cells/mouse). Tumor volumes were monitored (using a digital caliper) and on day 11, the mice were divided into three groups (8 or 9 mice per group), with each mouse containing a tumor with a volume between 60 and 100 mm3 and similar average volumes measured per group. The three mice groups were subjected to the following treatments: Xenografts were injected with phosphate-buffered saline ((•), control), with scrambled small interfering RNA (siRNA) (o) (10 µl of a 400 nmol/l solution) or with voltage-dependent anion channel (VDAC1)-siRNA (s) (10 µl of a 400 nmol/l solution). In a, xenograft sizes were measured on the indicated days and the calculated average tumor volumes are presented as means ± SEM, ***P < 0.001. In b, one-way repeated measures analysis of variance (ANOVA) indicated that the change in tumor volume over time differed significantly in the three treatment groups (treatment × time of interaction; F14,140 = 17.07, ***P < 0.001). The relative rate of growth in tumor volume of each individual was estimated using a nonlinear regression fitted to an exponential model (see Results section). One-way ANOVA indicated significant differences in relative growth rates in the three treatment groups (F2,20 = 42.59, ***P < 0.001). Tumors from mouse A549 cell xenografts were dissected (c), weighted, and the results were analyzed using the Mann–Whitney U-test (**P < 0.05) (d). in (e), Representative immunoblots of VDAC1 expression levels in lysates from xenografts of the four mice from each group and quantitation of their relative VDAC1 expression levels (relative units) are presented (**P < 0.0284, ***P < 0.004). (f) Dissected tumors were subjected to immunohistochemistry, carried out as described in the Materials and Methods. Photomicrographs showing immunohistochemical staining of tumor sections from two mice (I and II) from each group with anti-VDAC1 antibodies. Non-specific (NS) represents staining with only secondary antibodies. Arrowheads point to nonstained area. Bars represent 25 µm (5 µm for the enlarged section).

References

    1. Querbes W, Bogorad RL, Moslehi J, Wong J, Chan AY, Bulgakova E, et al. Treatment of erythropoietin deficiency in mice with systemically administered siRNA. Blood. 2012;120:1916–1922. - PMC - PubMed
    1. Petrocca F, Lieberman J. Promise and challenge of RNA interference-based therapy for cancer. J Clin Oncol. 2011;29:747–754. - PubMed
    1. Soutschek J, Akinc A, Bramlage B, Charisse K, Constien R, Donoghue M, et al. Therapeutic silencing of an endogenous gene by systemic administration of modified siRNAs. Nature. 2004;432:173–178. - PubMed
    1. Jagani H, Rao JV, Palanimuthu VR, Hariharapura RC, Gang S. A nanoformulation of siRNA and its role in cancer therapy: in vitro and in vivo evaluation. Cell Mol Biol Lett. 2013;18:120–136. - PMC - PubMed
    1. de Fougerolles A, Vornlocher HP, Maraganore J, Lieberman J. Interfering with disease: a progress report on siRNA-based therapeutics. Nat Rev Drug Discov. 2007;6:443–453. - PMC - PubMed