. 2014 Apr 29:5:3513.
doi: 10.1038/ncomms4513.

Geographic population structure analysis of worldwide human populations infers their biogeographical origins

Collaborators, Affiliations

Geographic population structure analysis of worldwide human populations infers their biogeographical origins

Eran Elhaik et al. Nat Commun. .

Erratum in

  • Corrigendum: Geographic population structure analysis of worldwide human populations infers their biogeographical origins.
    Elhaik E, Tatarinova T, Chebotarev D, Piras IS, Calò CM, De Montis A, Atzori M, Marini M, Tofanelli S, Francalacci P, Pagani L, Tyler-Smith C, Xue Y, Cucca F, Schurr TG, Gaieski JB, Melendez C, Vilar MG, Owings AC, Gómez R, Fujita R, Santos FR, Comas D, Balanovsky O, Balanovska E, Zalloua P, Soodyall H, Pitchappan R, GaneshPrasad A, Hammer M, Matisoo-Smith L, Wells RS. Elhaik E, et al. Nat Commun. 2016 Oct 31;7:13468. doi: 10.1038/ncomms13468. Nat Commun. 2016. PMID: 27796289 Free PMC article. No abstract available.

Abstract

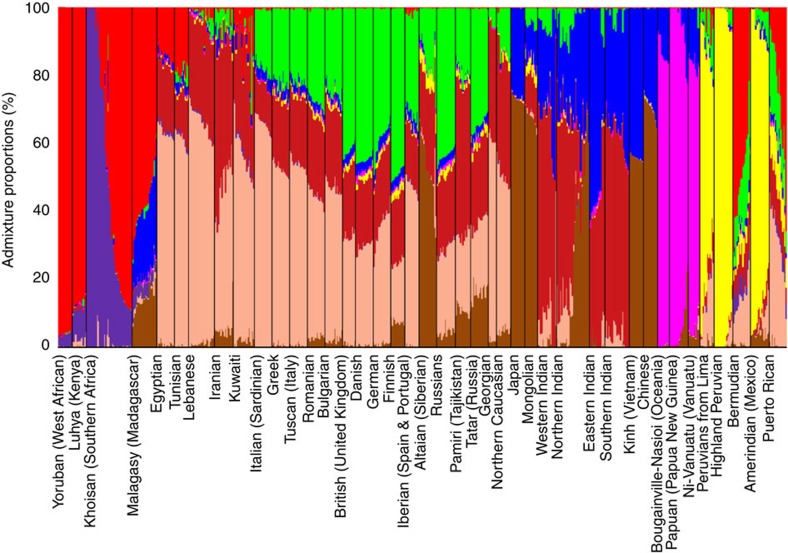
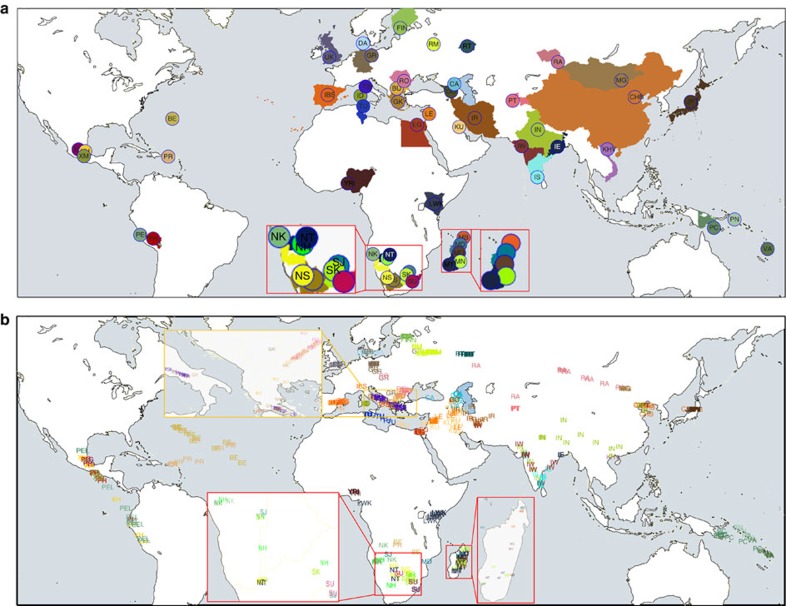
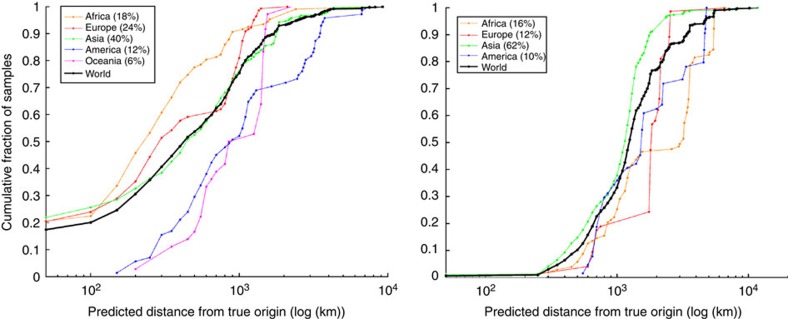
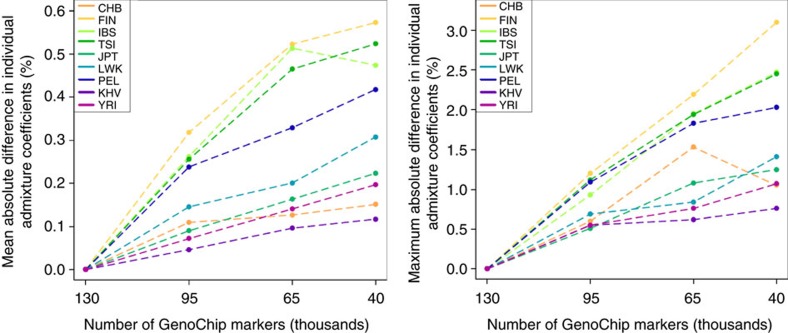
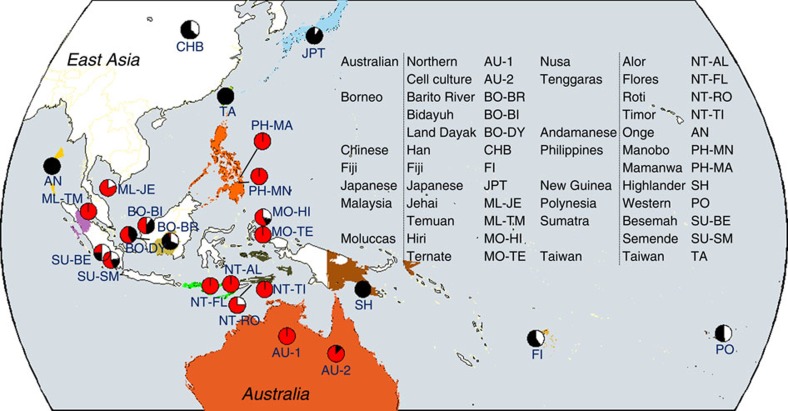
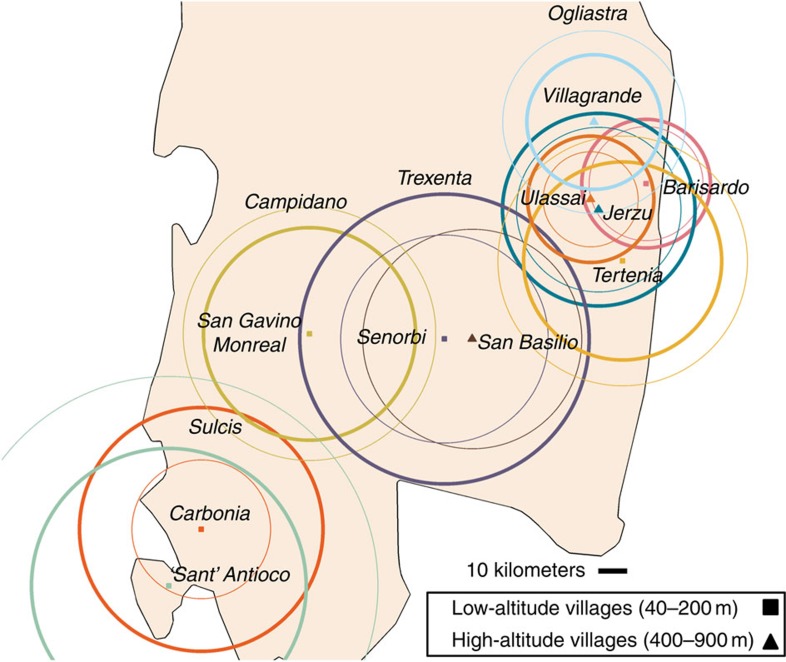
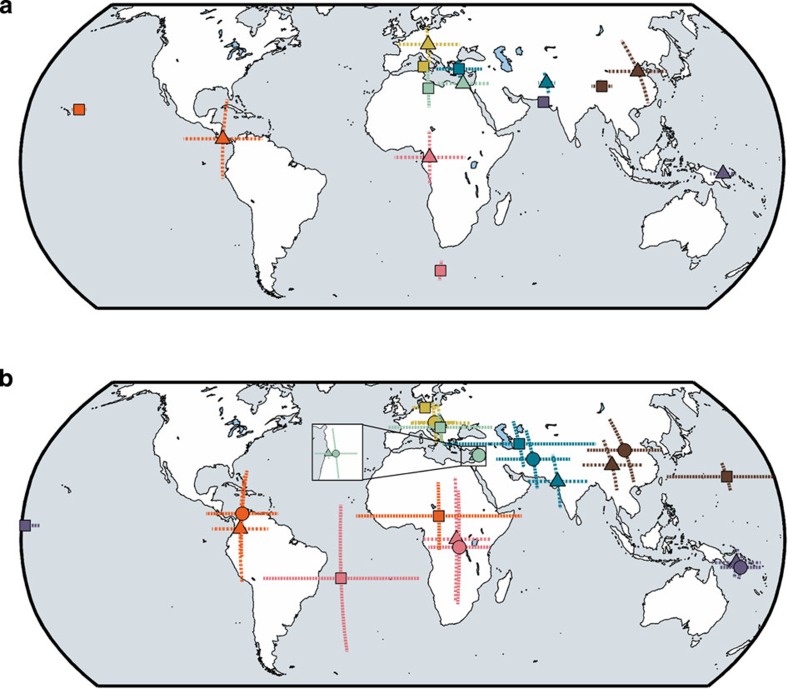
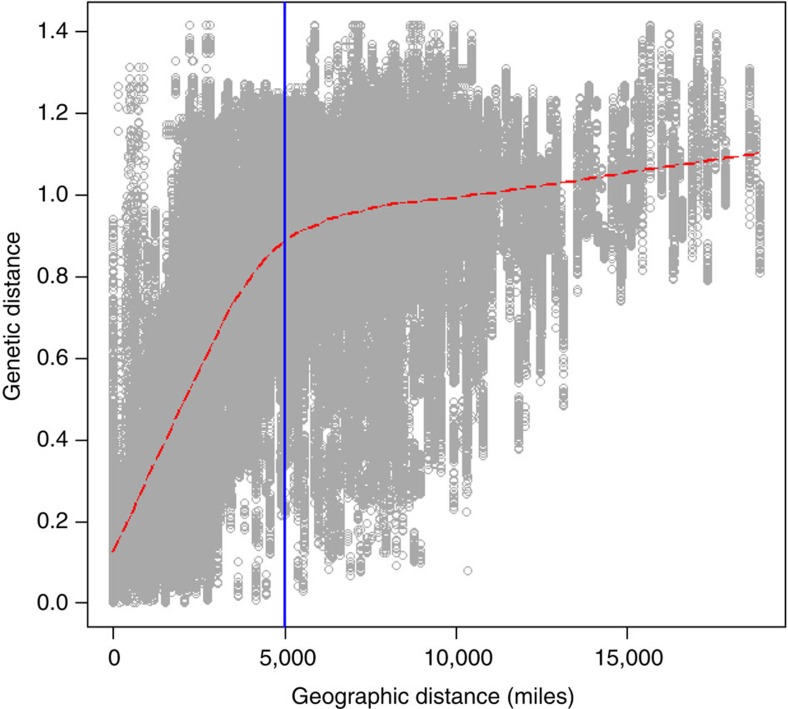
The search for a method that utilizes biological information to predict humans' place of origin has occupied scientists for millennia. Over the past four decades, scientists have employed genetic data in an effort to achieve this goal but with limited success. While biogeographical algorithms using next-generation sequencing data have achieved an accuracy of 700 km in Europe, they were inaccurate elsewhere. Here we describe the Geographic Population Structure (GPS) algorithm and demonstrate its accuracy with three data sets using 40,000-130,000 SNPs. GPS placed 83% of worldwide individuals in their country of origin. Applied to over 200 Sardinians villagers, GPS placed a quarter of them in their villages and most of the rest within 50 km of their villages. GPS's accuracy and power to infer the biogeography of worldwide individuals down to their country or, in some cases, village, of origin, underscores the promise of admixture-based methods for biogeography and has ramifications for genetic ancestry testing.


Conflict of interest statement

The authors declare no competing financial interests.

Figures

Figure 1
Figure 1. Admixture analysis of worldwide populations and subpopulations.
Admixture analysis was performed for K=9. For brevity, subpopulations were collapsed. The x axis represents individuals from populations sorted according to their reported ancestries. Each individual is represented by a vertical stacked column of colour-coded admixture proportions that reflects genetic contributions from putative ancestral populations.
Figure 2
Figure 2. Geographic origin of worldwide populations.
(a) Small coloured circles with a matching colour to geographical regions represent the 54 reference points used for GPS predictions. Each circle represents a geographical point with longitude and latitude and a certain admixture proportion. The insets provide magnification for dense regions. (b) GPS individual assignment based on 54 points. Individual label and colour match their known region/state/country of origin using the following legend: BE (Bermudian), BU (Bulgarian), CHB (Chinese), DA (Danish), EG (Egyptian), FIN (Finnish), GO (Georgian), GR (German), GK (Greek), I-S/N/W/E (India, Southern/Northern/Western/Eastern), IR (Iranian), ID/TSI (Italy: Sardinian/Tuscan), JPT (Japanese), LWK (Kenya: Luhya), KU (Kuwaiti), LE (Lebanese), M-O/B/N/D/T (Madagascar: Antananarivo/Ambilobe/Manakara/Andilambe/Toliara), X-G/H/M (Mexico: Guanajuato/Hidalgo/Morelos), MG (Mongolian), N-S/K/H/T (Namibia: Southeastern/Kaokoveld/Hereroland/Tsumkwe), YRI (Yoruba from West African), P-C/N (Papuan: Papua New Guinea/Bougainville-Nasioi), PH/PEL (Peruvian: Highland/Lima), PR (Puerto Rican), RO (Romanian), CA (Northern Caucasian), R-M/T/A (Russians: Moscow/Tatarÿ/Altaian), S-J/U/S/K/ (RSA: Johannesburg/Underberg/Northern Cape/Free State), IBS (Iberian from Spain & Portugal), PT (Pamiri from Tajikistan), TU (Tunisian), UK (British from United Kingdom), VA (Vanuatu), KHV (Vietnam). Note: occasionally all samples of certain populations (for example, Vietnamese) were predicted to the same spot and thus appear as a single sample.
Figure 3
Figure 3. Accuracy of assigning populations to their origin is coloured with dark blue for countries and light blue for regional locations.
Populations for which regional data were available are marked with an asterisk. The average accuracy per population is shown in red and is calculated across populations given equal weights.
Figure 4
Figure 4. Predicted distance from true origin for each individual using the leave-one-out procedure at the population level.
Calculated for individuals of the Genographic (left) and the HGDP (right) data sets.
Figure 5
Figure 5. Estimation of the bias in the admixture proportions of nine 1000 Genomes populations analysed over a reduced set of GenoChip markers.
The mean (left) and maximum (right) absolute difference in individual admixture coefficients are shown.
Figure 6
Figure 6. Prediction accuracy for Southeast Asian and Oceanian subpopulations and populations.
Pie charts depicts correct mapping at the subpopulation level (red), population level (black) and incorrect mapping (white).
Figure 7
Figure 7. The geographical location of the examined Sardinian villages.
The mean predicted distances (km) from the village of origin are marked by bold (females) and plain (males) circles.
Figure 8
Figure 8. A comparison of SPA and GPS prediction accuracy for continental regions.
The mean longitude and latitude for each population were calculated by averaging individual spatial assignments (N=596). After assigning populations to continental regions, the mean and s.d. were calculated based on the predicted coordinates for each region. Dashed lines mark s.d. (a) SPA prediction accuracy for continental regions obtained from Yang et al. results (their supplementary Table 112). The mean coordinates are marked with a triangle (expected) and square (Predicted by SPA). (b) Comparing the results for worldwide populations analysed here for SPA (square), GPS (circle) and for the real coordinates (triangle).
Figure 9
Figure 9. Geographic versus genetic distances plotted for every two worldwide individuals.
A loess distribution fitting is shown in red line with blue bar marking the limit of the linear fitting.

References

    1. Tishkoff S. A. & Kidd K. K. Implications of biogeography of human populations for ‘race’ and medicine. Nat. Genet. 36, S21–S27 (2004). - PubMed
    1. Harcourt A. H. Human Biogeography University of California Press (2012).
    1. Darwin C. The Descent of Man and Selection in Relation to Sex John Murray London (1871).
    1. Rowe J. H. The Renaissance Foundations of Anthropology. American Anthropologist 67, 1–20 (1965).
    1. Cavalli-Sforza L. L. L., Menozzi P. & Piazza A. The History and Geography of Human Genes Princeton university press (1994).

Publication types