. 2014 Aug;20(4):341-51.
doi: 10.1007/s13365-014-0249-3. Epub 2014 Apr 30.

Digital droplet PCR (ddPCR) for the precise quantification of human T-lymphotropic virus 1 proviral loads in peripheral blood and cerebrospinal fluid of HAM/TSP patients and identification of viral mutations

Affiliations

Digital droplet PCR (ddPCR) for the precise quantification of human T-lymphotropic virus 1 proviral loads in peripheral blood and cerebrospinal fluid of HAM/TSP patients and identification of viral mutations

Giovanna S Brunetto et al. J Neurovirol. 2014 Aug.

Abstract

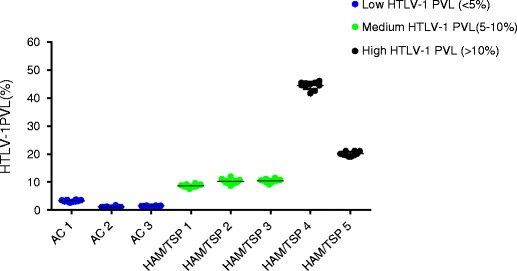
An elevated human T cell lymphotropic virus 1 (HTLV)-1 proviral load (PVL) is the main risk factor for developing HTLV-1-associated myelopathy/tropical spastic paraparesis (HAM/TSP) in HTLV-1 infected subjects, and a high cerebrospinal fluid (CSF) to peripheral blood mononuclear cell (PBMC) PVL ratio may be diagnostic of the condition. However, the standard method for quantification of HTLV-1 PVL-real-time PCR-has multiple limitations, including increased inter-assay variability in compartments with low cell numbers, such as CSF. Therefore, in this study, we evaluated a novel technique for HTVL-1 PVL quantification, digital droplet PCR (ddPCR). In ddPCR, PCR samples are partitioned into thousands of nanoliter-sized droplets, amplified on a thermocycler, and queried for fluorescent signal. Due to the high number of independent events (droplets), Poisson algorithms are used to determine absolute copy numbers independently of a standard curve, which enables highly precise quantitation. This assay has low intra-assay variability allowing for reliable PVL measurement in PBMC and CSF compartments of both asymptomatic carriers (AC) and HAM/TSP patients. It is also useful for HTLV-1-related clinical applications, such as longitudinal monitoring of PVL and identification of viral mutations within the region targeted by the primers and probe.


Figures

Fig. 1
Fig. 1
Representative two-dimensional ddPCR plots of individuals with increasing HTLV-PVL. a PBMC DNA from a normal blood donor. b PBMC DNA from an HTLV-1-infected individual with a PVL of 3.25 %. c PBMC DNA from an HTLV-1-infected individual with a PVL of 8.46 %. d PBMC DNA from an HTLV-1-infected individual with a PVL of 19.50 %
Fig. 2
Fig. 2
Statistically significant differences in HTLV-1 PBMC PVL between HAM/TSP patients, asymptomatic carriers, and healthy donors. Mann-Whitney tests were performed to compare differences between groups in sets of pairs. HAM/TSP PBMC PVL were statistically different from asymptomatic carrier PBMC PVL, p = 0.0093 (**). HAM/TSP PBMC PVL were also statistically different from healthy donor PBMC PVL, p < 0.0001 (****). Asymptomatic carrier PBMC PVL versus healthy donor PBMC PVL were also statistically different, p = 0.002 (***)
Fig. 3
Fig. 3
Strong correlation between ddPCR and qPCR for HTLV-1 PBMC PVL quantitation, though ddPCR has lower inter-assay variability. a Replicate, non-normalized PBMC PVL values obtained for five HAM/TSP patients using qPCR and ddPCR were similar, though the values obtained by ddPCR were consistently higher. b A strong correlation exists between the normalized PVL values for ddPCR and qPCR (Pearson correlation coefficient, R 2 = 0.97). c An ROC analysis of the normalized PVL values for each method indicates that the assays perform similarly for HTLV-1 PVL estimation. d Comparison of each method’s normalized values demonstrates that ddPCR has a lower coefficient of variation compared to qPCR
Fig. 4
Fig. 4
Low intra-assay variability by ddPCR over a wide range of HTLV-1 PBMC PVL. The intra-assay variability of ddPCR for low, medium, and high PVL groups was evaluated by running ten replicates of PBMC DNA from eight patients (three AC and five HAM/TSP). For the low PVL group (<5 %), the mean PVL was 1.85 % with a mean CV of 13.7 %. For the medium PVL group (5–10 %), the mean PVL was 9.77 % with a mean CV of 7.44 %. For the high PVL group (>10 %), the mean PVL was 32.245 with a mean CV of 3.4 %
Fig. 5
Fig. 5
Elevated CSF to PBMC PVL in HAM/TSP patients demonstrated by ddPCR. HTLV-1 PVL is elevated in the CSF of seven HAM/TSP patients relative to matched PBMC, by approximately 2.8-fold. For each patient, there is a significant difference between PBMC and CSF HTLV-1 PVL (paired t test, p = 0.0036)
Fig. 6
Fig. 6
HAM/TSP patients’ PBMC PVL are relatively stable over a period of approximately 4 years. a HAM/TSP patient 15 had a mean PVL of 18.13 %. b HAM/TSP patient 13 had a mean PVL of 12.3 %. c HAM/TSP patient 14 had a mean PVL of 9.16 %. d HAM/TSP patient 3 had a mean PVL of 10.25 %
Fig. 7
Fig. 7
DdPCR fluorescence profile indicates mutations in viral region targeted by primers/probe. a A typical one-dimensional droplet profile for HAM/TSP patients has a positive HTLV-1 tax population at a fluorescence amplitude of 9,000 (red arrow). b The HTLV-1 tax-positive droplets for HAM/TSP patient 16 were observed around an amplitude of 3,500 (red arrow). c Sequence alignment revealed that HAM/TSP patient 16 has eight point mutations (indicated in red) in the region of HTLV-1 tax targeted by the ddPCR primers/probe, one in the probe-binding region. The primer-binding regions are italicized, and the probe-binding region is underlined. d A typical one-dimensional droplet profile for HAM/TSP patients has a positive HTLV-1 gag population at a fluorescence amplitude of 11,000 (red arrow). e The HTLV-1 gag positive droplets for HAM/TSP patient 19 were observed around an amplitude of 4,000 (red arrow). f Sequence alignment revealed that HAM/TSP patient 19 has one point mutation (indicated in red) in the region targeted by the gag probe (underlined)

References

    1. Araya N, Sato T, Yagishita N, Ando H, Utsunomiya A, Jacobson S, Yamano Y. Human T-lymphotropic virus type 1 (HTLV-1) and regulatory T cells in HTLV-1-associated neuroinflammatory disease. Viruses. 2011;3(9):1532–1548. doi: 10.3390/v3091532. - DOI - PMC - PubMed
    1. Archanjo M, Batista, Fukutani, Bittencourt, Farre HTLV-1 proviral load levels in adult T-cell leukemia/lymphoma (ATL) in Bahia, Brazil. Retrovirology. 2011;8:A91. doi: 10.1186/1742-4690-8-S1-A91. - DOI
    1. Demontis MA, Hilburn S, Taylor GP. Human T cell lymphotropic virus type 1 viral load variability and long-term trends in asymptomatic carriers and in patients with human T cell lymphotropic virus type 1-related diseases. AIDS Res Hum Retrovir. 2013;29(2):359–364. - PubMed
    1. Furtado Mdos S, Andrade RG, Romanelli LC, Ribeiro MA, Ribas JG, Torres EB, Barbosa-Stancioli EF, Proietti AB, Martins ML. Monitoring the HTLV-1 proviral load in the peripheral blood of asymptomatic carriers and patients with HTLV-associated myelopathy/tropical spastic paraparesis from a Brazilian cohort: ROC curve analysis to establish the threshold for risk disease. J Med Virol. 2012;84(4):664–671. doi: 10.1002/jmv.23227. - DOI - PubMed
    1. Gessain A, Mahieux R. Tropical spastic paraparesis and HTLV-1 associated myelopathy: clinical, epidemiological, virological and therapeutic aspects. Rev Neurol (Paris) 2012;168(3):257–269. doi: 10.1016/j.neurol.2011.12.006. - DOI - PubMed