

Competition in notch signaling with cis enriches cell fate decisions
- PMID: 24781918
- PMCID: PMC4004554
- DOI: 10.1371/journal.pone.0095744
Competition in notch signaling with cis enriches cell fate decisions
Abstract
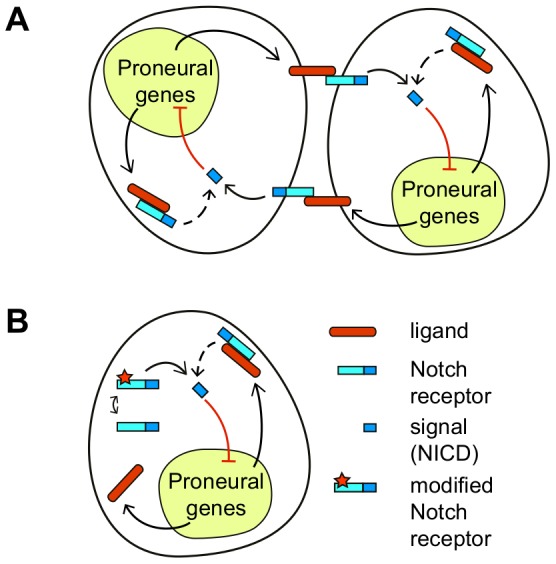
Notch signaling is involved in cell fate choices during the embryonic development of Metazoa. Commonly, Notch signaling arises from the binding of the Notch receptor to its ligands in adjacent cells driving cell-to-cell communication. Yet, cell-autonomous control of Notch signaling through both ligand-dependent and ligand-independent mechanisms is known to occur as well. Examples include Notch signaling arising in the absence of ligand binding, and cis-inhibition of Notch signaling by titration of the Notch receptor upon binding to its ligands within a single cell. Increasing experimental evidences support that the binding of the Notch receptor with its ligands within a cell (cis-interactions) can also trigger a cell-autonomous Notch signal (cis-signaling), whose potential effects on cell fate decisions and patterning remain poorly understood. To address this question, herein we mathematically and computationally investigate the cell states arising from the combination of cis-signaling with additional Notch signaling sources, which are either cell-autonomous or involve cell-to-cell communication. Our study shows that cis-signaling can switch from driving cis-activation to effectively perform cis-inhibition and identifies under which conditions this switch occurs. This switch relies on the competition between Notch signaling sources, which share the same receptor but differ in their signaling efficiency. We propose that the role of cis-interactions and their signaling on fine-grained patterning and cell fate decisions is dependent on whether they drive cis-inhibition or cis-activation, which could be controlled during development. Specifically, cis-inhibition and not cis-activation facilitates patterning and enriches it by modulating the ratio of cells in the high-ligand expression state, by enabling additional periodic patterns like stripes and by allowing localized patterning highly sensitive to the precursor state and cell-autonomous bistability. Our study exemplifies the complexity of regulations when multiple signaling sources share the same receptor and provides the tools for their characterization.
Conflict of interest statement
Figures
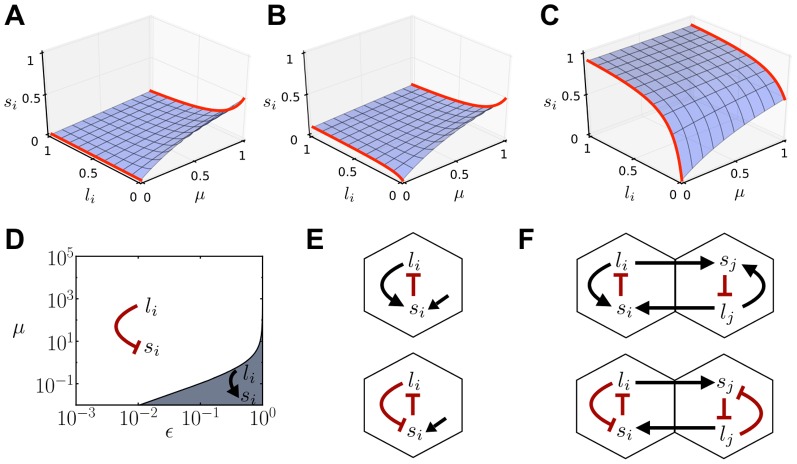
 ) versus the amount of ligand in that cell (
 ) and the amount of primary signaling source (
 ) for (A)
  , (B)
, (B)  and (C)
  . Red lines show the Notch signal dependence on
  in the absence of the primary signaling source (
 ) and for a primary signaling source with
  . Decreasing curves indicate cis-inhibition and increasing curves show cis-activation. In B, cis-interactions drive cis-activation at low
  values, whereas they drive cis-inhibition at higher
  . (D) Parameter space showing where cis-activation (gray region) and cis-inhibition (white region) occurs, according to inequality 5. (E–F) Effective circuit architectures of the model when cis-interactions drive cis-activation (top) and cis-inhibition (bottom) for (E) isolated cells with a primary signaling source (straight arrow) and for (F) two adjacent cells that interact through trans-binding. Black arrows stand for activation, while red blunt arrows for inhibition. Parameter values:
  in panels A–C,
  and
and  in panel D.
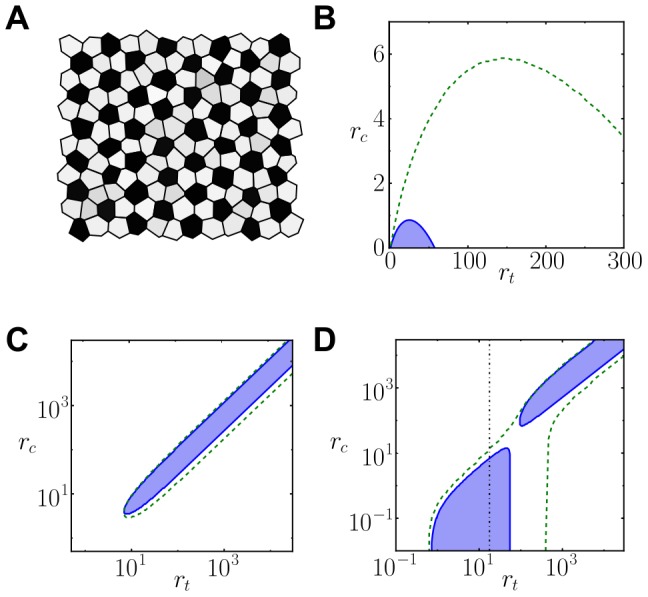
 ). Grayscale is used to denote the ligand level (black for high ligand,
  , and white for low ligand,
  ). (B–D) Regions of patterning for cis-interactions and trans-interactions strengths
  for (B)
  (cis-activation), (C)
  (cis-inhibition) and (D)
  . The black dot-dashed line in D divides the parameter space into the cis-activation region, on its left, and the cis-inhibition region, on its right. Blue regions show where the pattern grows spontaneously (LSA in Methods). Green dashed lines enclose the regions where lateral inhibition pattern solutions exist and are stable (Exact periodic solutions in Methods). In B, the patterning region is the one below the green dashed line. B and D show that patterning becomes forbidden as
  increases when cis-activation is acting. C and D show that patterning is enabled above a minimal cis-interactions strength
  when there is cis-inhibition. Other parameter values:
  for all panels,
  and
and  for A,
  for A–B and D,
  for C.
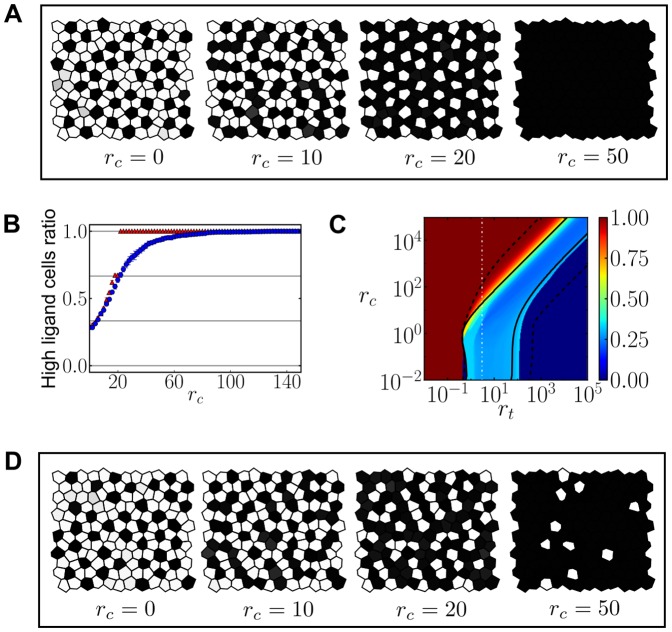
 . Color code as in Fig. 3A. (B) Ratio of stationary high-ligand fated cells as a function of the cis-interactions strength
  when precursor cells show small (red triangles) and large (blue circles) initial variability between them. (C) Density plot representing the ratio of high-ligand cells in a tissue arising from precursor cells exhibiting large initial variability. Solid and dashed lines as defined in Fig. 3B–D. White vertical line is drawn for indicating the value
  along which simulations are performed in panels A, B and D. (D) Stationary patterns of ligand levels arising from precursor cells with large initial variability between them for different inhibiting cis-interactions strengths
  . In B–C panels, cells are considered high-ligand fated cells when its ligand level is over the threshold of
  . Parameter values:
  ,
,  ,
,  and
and  for all panels. Similar results are found for
  (Fig. S5). In B, each point comes from the average of
  numerical integrations of the dynamics on a lattice of
  irregular cells starting at different initial conditions. In C, the results correspond to numerical integration of the dynamics performed over a lattice of
  perfect hexagonal cells.
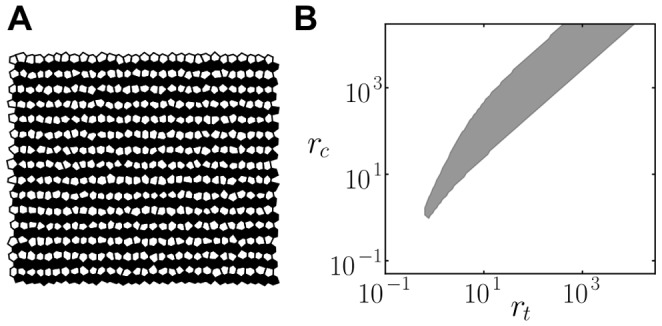
 and
and  . Parameter values:
  ,
,  and
and  for all panels and
  and
and  for panel A. The stripped pattern appears also for
  in the cis-inhibition regime (data not shown).
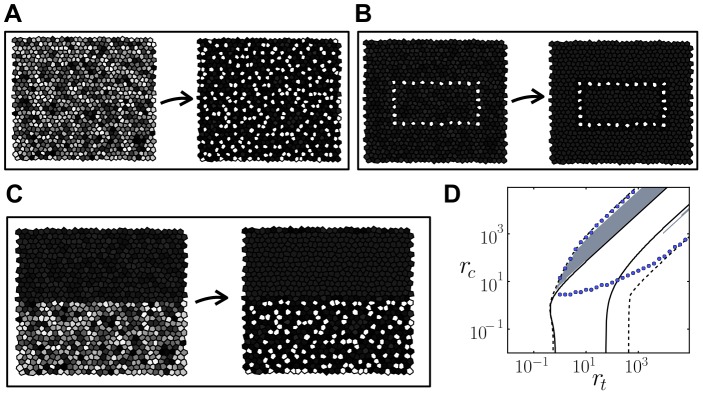
 in the cis-inhibition regime for different initial conditions: (A) all precursor cells have large initial random variability, (B) few precursor cells, distributed along a rectangle, have initial low ligand levels and (C) precursors within the top half of the tissue have initial high ligand levels and small variability, while precursors at the bottom half show large initial random variability in the level of ligand. In A–C, the final pattern strongly depends on the pattern formed by precursor cells. In (C) the pattern arises in a localized region (bottom half) and does not expand. (D) Region where localized patterns are found in a regular hexagonal array (gray) in the parameter space of cis and trans-interactions strengths
  and
and  . Blue circles enclose the region for cell-autonomous bistability, where two states are linearly stable, according to simulation results (Methods). Solid and dashed lines as in Fig. 3B–D respectively. Parameter values:
  ,
,  ,
,  and
and  for all panels and
  and
and  for (A–C).
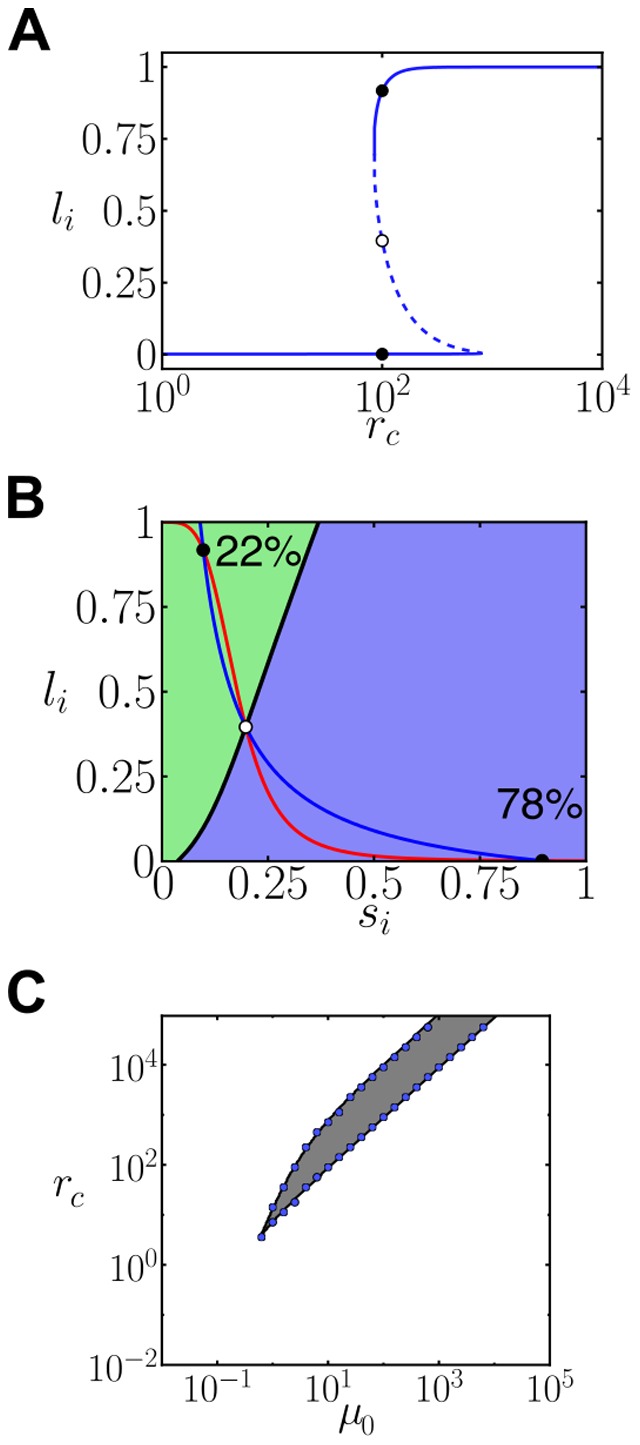
 for
for  and
and  . Solid lines denote linearly stable solutions, dashed lines indicate linearly unstable solutions. Black dots refer to the stationary ligand levels for
  . (B) Nullclines diagram showing the three possible solutions at
  . The blue and red lines represent the nullclines. The continuous black line is a separatrix, which divides the parameter space into two basins of attraction of the two stable solutions. Percentages indicate the fraction of cells reaching the corresponding stable state computed from
  cells with initial random uniform levels of ligand. (C) Phase diagram showing the cell-autonomous bistability region zone where two states are linearly stable. The gray area is the theoretically computed region, and the blue circles correspond to simulation results (Methods). Parameter values:
  ,
,  ,
,  and
and  for all panels. These results can also be obtained for
  in the cis-inhibition regime (data not shown).
References
-
- Artavanis-Tsakonas S, Rand M, Lake R (1999) Notch signaling: cell fate control and signal integration in development. Science 284: 770. - PubMed
-
- Schwanbeck R, Martini S, Bernoth K, Just U (2011) The notch signaling pathway: molecular basis of cell context dependency. Eur J Cell Biol 90: 572–81. - PubMed
-
- Andersson ER, Sandberg R, Lendahl U (2011) Notch signaling: simplicity in design, versatility in function. Development 138: 3593–612. - PubMed
-
- Fehon R, Kooh P, Rebay I, Regan C, Xu T, et al. (1990) Molecular interactions between the protein products of the neurogenic loci notch and delta, two egf-homologous genes in drosophila. Cell 61: 523–534. - PubMed
Publication types
MeSH terms
Substances
Grants and funding
LinkOut - more resources
Full Text Sources
Other Literature Sources
