Clinical Trial
. 2014 Jun 12;123(24):3750-9.
doi: 10.1182/blood-2014-01-552174. Epub 2014 Apr 29.

Closely related T-memory stem cells correlate with in vivo expansion of CAR.CD19-T cells and are preserved by IL-7 and IL-15

Affiliations
Clinical Trial

Closely related T-memory stem cells correlate with in vivo expansion of CAR.CD19-T cells and are preserved by IL-7 and IL-15

Yang Xu et al. Blood. .

Abstract

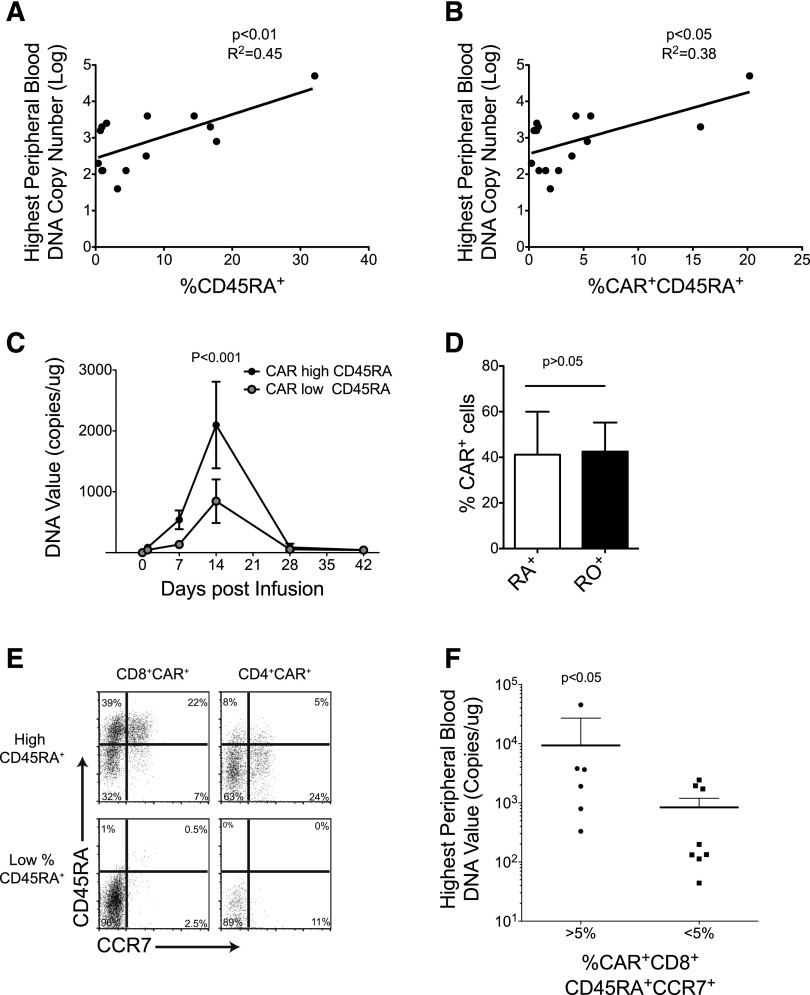
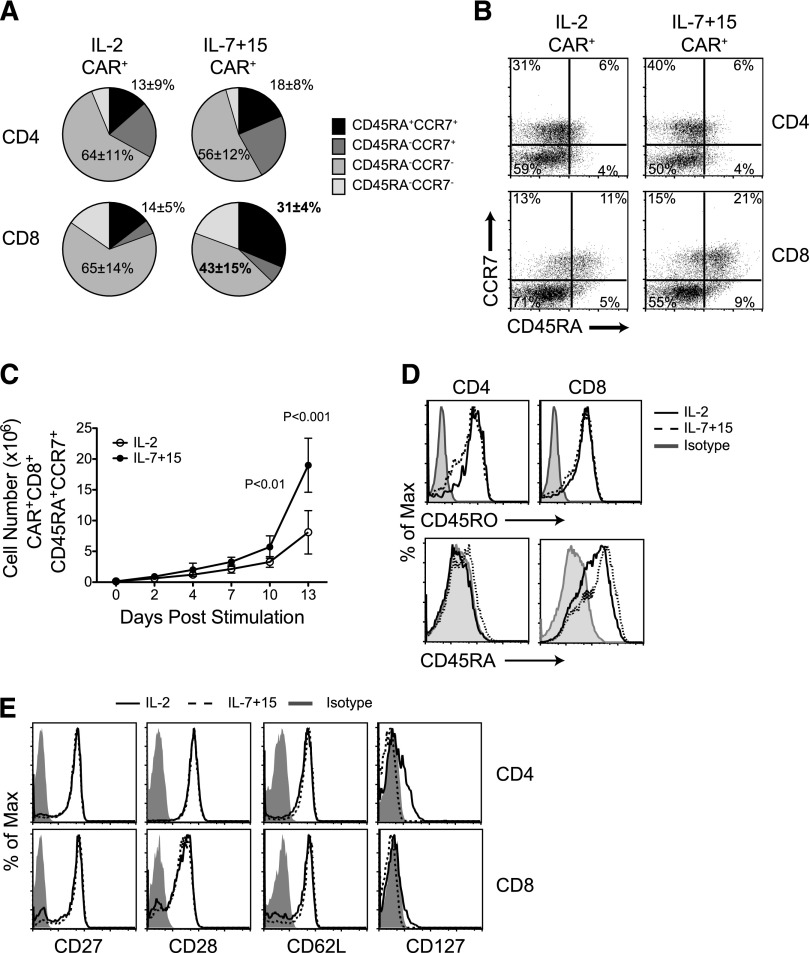
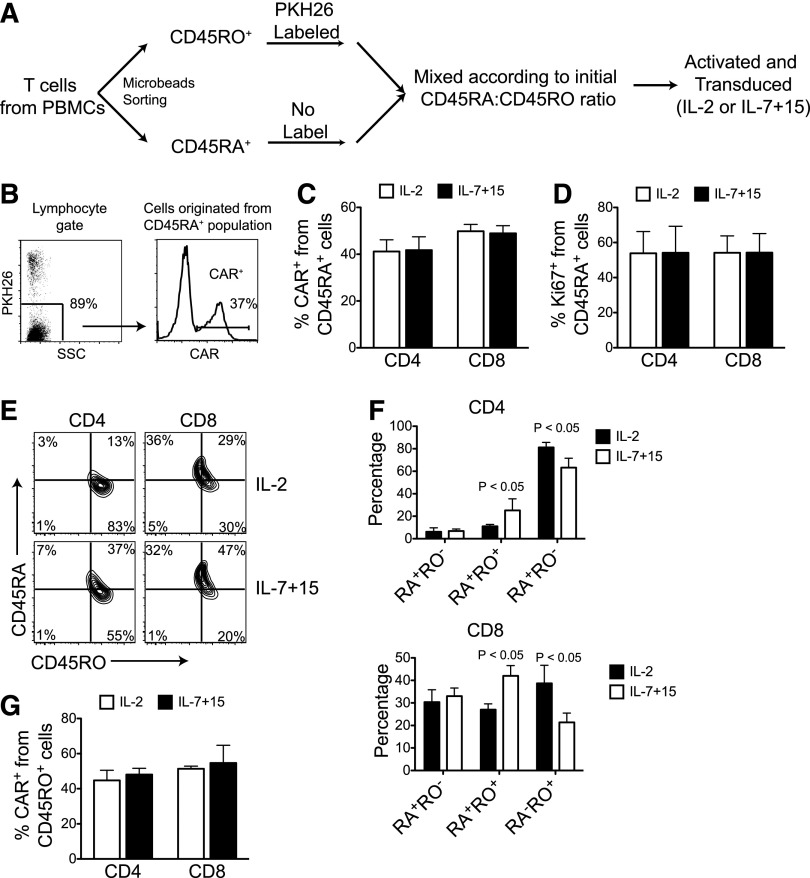
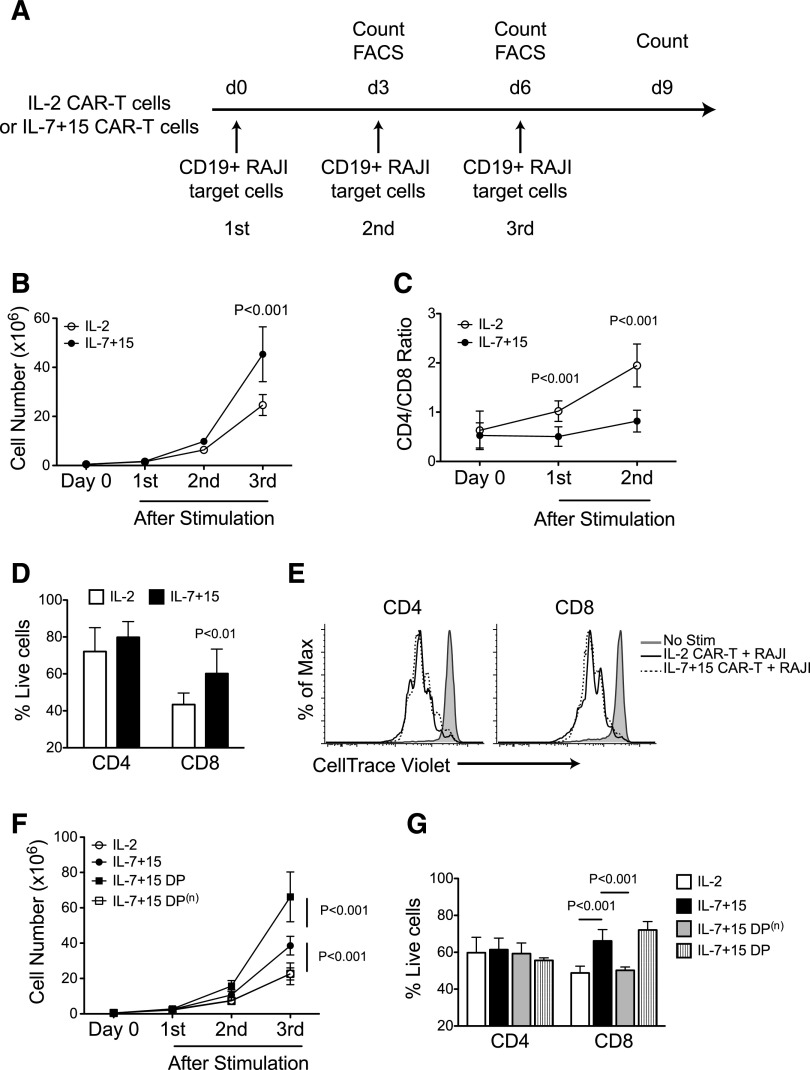
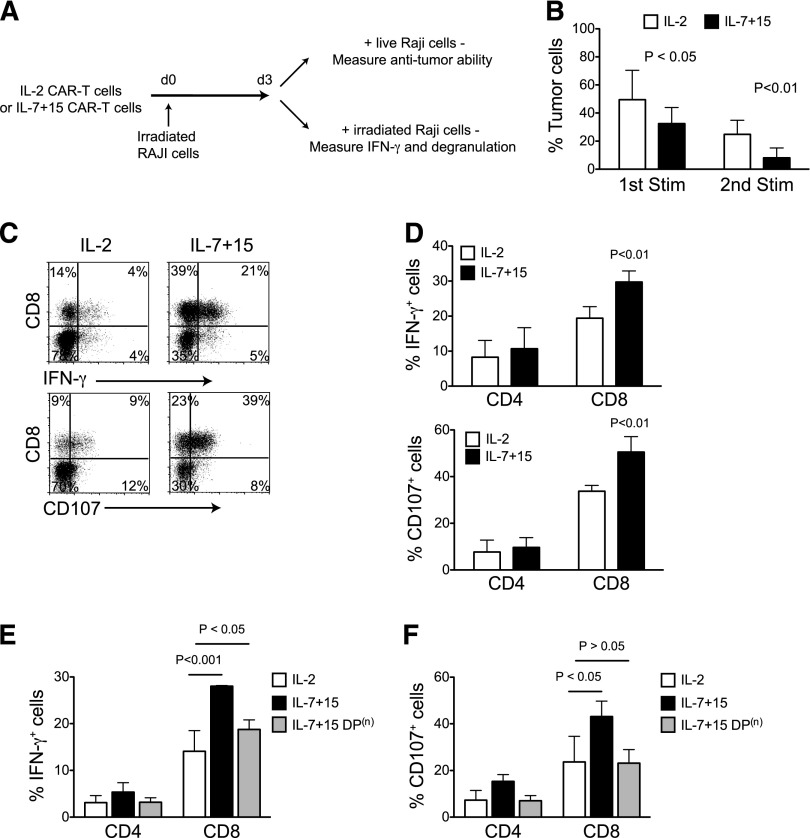
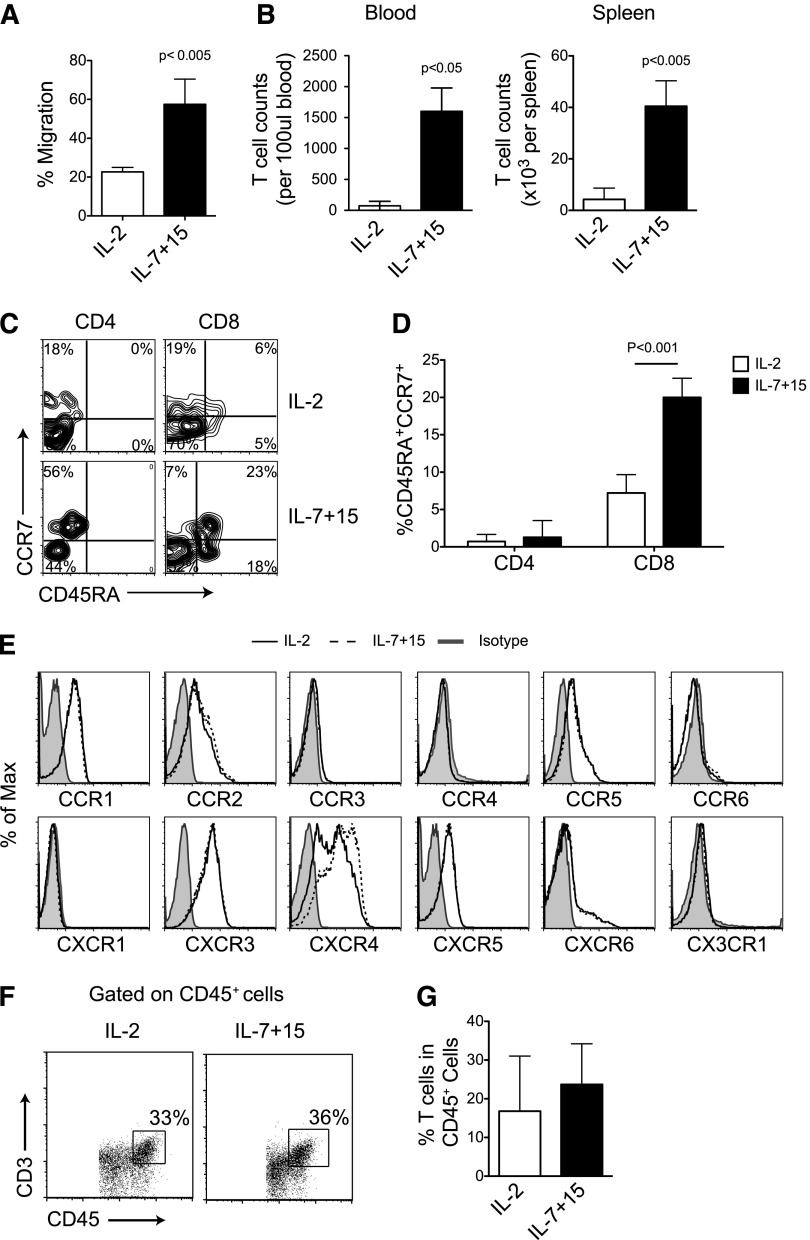
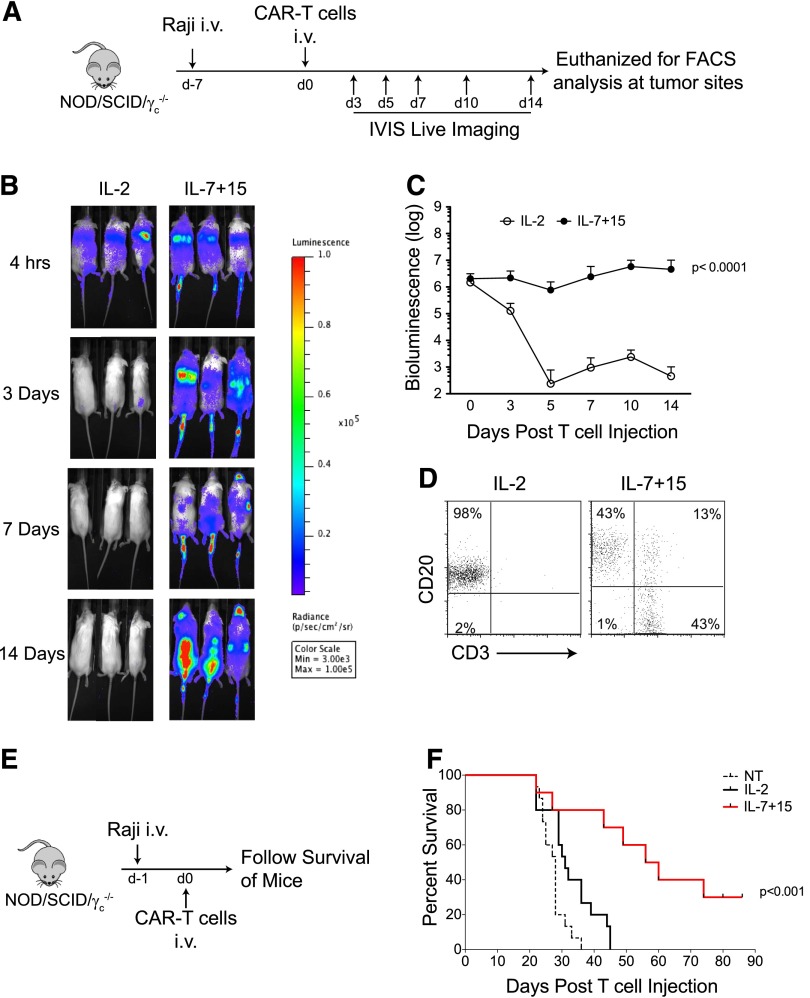
Adoptive transfer of T lymphocytes expressing a CD19-specific chimeric antigen receptor (CAR.CD19) induces complete tumor regression in patients with lymphoid malignancies. Although in vivo persistence of CAR-T cells correlates with clinical responses, it remains unknown whether specific cell subsets within the CAR-T-cell product correlate with their subsequent in vivo expansion and persistence. We analyzed 14 patients with B-cell malignancies infused with autologous CAR.CD19-redirected T cells expanded ex vivo using IL-2, and found that their in vivo expansion only correlated with the frequency within the infused product of a CD8(+)CD45RA(+)CCR7(+) subset, whose phenotype is closest to "T-memory stem cells." Preclinical models showed that increasing the frequency of CD8(+)CD45RA(+)CCR7(+) CAR-T cells in the infused line by culturing the cells with IL-7 and IL-15 produced greater antitumor activity of CAR-T cells mediated by increased resistance to cell death, following repetitive encounters with the antigen, while preserving their migration to secondary lymphoid organs. This trial was registered at www.clinicaltrials.gov as #NCT00586391 and #NCT00709033.


Figures

Figure 1
Figure 1
Co-expression of CD8, CD45RA, and CCR7 in CAR-T cells correlates with their in vivo expansion in lymphoma patients. (A-B) Illustrates the correlation between the percentage of CD45RA+ and CAR+CD45RA+ cells in the T-cell products and the peaks of the qPCR signals of CAR-T cells in the peripheral blood of infused patients. (C) Detection of CAR-T cells by qPCR in the peripheral blood of patients who received T-cell products with low or high CAR+CD45RA+ cells, respectively. (D) Equal CAR expression by phenotypic analysis in CD45RA+ and CD45RO+ cells. (E) Representative flow cytometry plots of CAR-T cells with low and high frequency of CD8+CD45RA+CCR7+ cells. (F) Peaks of the qPCR signals of CAR-T cells in the peripheral blood of patients infused with CAR-T cell lines containing >5% or <5% CAR+CD8+CD45+CCR7+ cells.
Figure 2
Figure 2
IL-7 and IL-15 better preserve CD8+ CD45RA+ CCR7+ cells in ex vivo expanded CAR-T cells than IL-2. (A) T-cell memory phenotypic analysis based on CD45RA and CCR7 expression by CAR-T cells exposed to either IL-2 or IL-7 and IL-15 (n = 4). (B) Representative flow cytometry analysis. (C) Numeric expansion of CAR+CD8+CD45RA+CCR7+ cells in culture conditions with either IL-2 or IL-7 and IL-15 (n = 3). (D) Expression of the CD45RO and CD45RA isoforms by CAR-T cells. Data shown are representative of 3 independent experiments. (E) Expression of CD27, CD28, CD62L, and CD127 in CAR-T cells. Data shown are representative of 3 independent experiments.
Figure 3
Figure 3
IL-7 and IL-15 do not promote preferential transduction of naïve T cells. (A) Schematic representation of the labeling process to distinguish T cells originated from naïve (CD45RA+) and antigen-experienced (CD45RO+) T cells by labeling with PKH26 dye before activation and retroviral transduction with either IL-2 or IL-7 and IL-15. (B) Gating strategy and representative data showing CAR expression by T cells originated from naive T cells. (C) CAR expression in PKH26 cells (originally CD45RA+) after activation and transduction (n = 5). (D) Percentage of Ki67+ cells on PKH26 cells (originally CD45RA+) prior to retroviral transduction (n = 5). (E-F) Expression of CD45RA and CD45RO on PKH26 cells (originally CD45RA+) after activation and transduction. Representative dot plots (E) and summary of 3 experiments (F). (G) CD45RA+ cells were labeled with PKH26, and transduction on PKH26- cells (originally CD45RO+) was assessed (n = 3).
Figure 4
Figure 4
CAR-T cells exposed to IL-7 and IL-15 display superior proliferative capacity after serial stimulations. (A) CAR-T cells expanded with IL-2 or IL-7 and IL-15 were stimulated 3 times with irradiated CD19+ target tumor cells (Raji) in the absence of exogenous cytokines. After each stimulation, cells were counted and phenotypic analysis was performed by flow cytometry. (B) Cell count of CAR-T cells after each antigen stimulation (n = 4). (C) Ratio of CD4+ and CD8+ T cells before and after 2 consecutive antigen stimulations (n = 5). (D) Apoptosis of CD4+ and CD8+ CAR-T cells after antigen stimulation assessed by Annexin-V and 7-AAD staining (n = 3). (E) CAR-T cells were labeled with CFSE before being stimulated by tumor cells. CFSE dilution was determined by flow cytometry on CD4+ and CD8+ T cells by day 3 of culture. Data shown are representative of 3 independent experiments. (F-G) CD45RA and CCR7 DP T cells were sorted by flow cytometry from IL-7 and IL-15 expanded CAR-T cells (IL-7+15 DP). Negative fraction was also collected as IL-7+15 DP(n). After sorting, IL-2 expanded (IL-2), IL-7 and IL-15 expanded (IL-7+15), IL-7/15 DP, IL-7, and IL-15 DP(n) CAR-T cells were stimulated as in (A). Cell counts (F) and apoptosis on CD4+ or CD8+ T cells (G) were measured by flow cytometry (n = 3).
Figure 5
Figure 5
CAR-T cells exposed to IL-7 and IL-15 display superior effector function after serial stimulations. (A) CAR-T cells expanded with IL-2 or IL-7 and IL-15 were first stimulated with irradiated CD19+ target tumor cells (Raji). Three days after stimulation, cells were collected and subjected to coculture and intracellular cytokine production assays. (B) CAR-T cells were cocultured with target tumor cells at 1:3 E:T ratio. Percentages of residual tumor cells in the culture were determined by flow cytometry by day 3 of culture (n = 4). (C-D) Intracellular IFN-γ staining and degranulation analysis of CAR-T cells after the 2nd consecutive antigen stimulation (n = 4). Minimal (<2%) expression of IFN-γ or CD107 was observed when cells were not stimulated by Raji. (E-F) Intracellular IFN-γ staining and degranulation analysis of CAR-T cells after the 2nd consecutive antigen stimulation after depletion of the DP subset (n = 3).
Figure 6
Figure 6
High CCR7 expression of CAR-T cells exposed to IL-7 and IL-15 facilitates homing to secondary lymphoid organs. (A) Equal numbers of CAR-T cells expanded either with IL-2 or IL-7 and IL-15 were subjected to migration assay toward CCL21 (n = 4). (B) NSG mice were subcutaneously implanted with EBV-LCL and then infused with CAR-T cells. CD45+CD3+ cells were numerated by flow cytometry in blood and spleen 3 days after T-cell infusion (n = 5). (C-D) Expression of CD45RA and CCR7 in CAR-T cells in vivo. Data summarize 3 mice per group from 2 independent experiments. (E) Expression of other chemokine receptors by CAR-T cells. Data shown are representative of 3 independent experiments. (F-G) Detection of CAR-T cells at the tumor sites in vivo. Data are obtained from 3 mice per group from 2 independent experiments.
Figure 7
Figure 7
CAR-T cells exposed to IL-7 and IL-15 have improved in vivo persistence and antitumor activity. (A) Schematic representation of the experiments in NSG mice to compare persistence of CAR-T cells expanded with either IL-2 or IL-7 and IL-15. (B-C) Time-course of T-cell luminescence in mice engrafted with Raji tumor cells. Data summarize 10 mice per group from 2 independent experiments. (D) Detection of CAR-T cells in the spinal cord 2 weeks after CAR-T cell adoptive transfer. Data shown are representative of 5 mice per group from 2 independent experiments. (E) Schematic representation of the experiments in NSG mice to measure the antitumor effects of CAR-T cells expanded with either IL-2 or IL-7 and IL-15. (F) Survival curve of mice after infusion of control and CAR-T cells. Data illustrate the summary of 3 independent experiments for a total of 15 mice per group.

References

    1. Grupp SA, Kalos M, Barrett D, et al. Chimeric antigen receptor-modified T cells for acute lymphoid leukemia. N Engl J Med. 2013;368(16):1509–1518. - PMC - PubMed
    1. Kalos M, Levine BL, Porter DL, et al. T cells with chimeric antigen receptors have potent antitumor effects and can establish memory in patients with advanced leukemia. Sci Transl Med. 2011;3(95):95ra73. - PMC - PubMed
    1. Porter DL, Levine BL, Kalos M, Bagg A, June CH. Chimeric antigen receptor-modified T cells in chronic lymphoid leukemia. N Engl J Med. 2011;365(8):725–733. - PMC - PubMed
    1. Scholler J, Brady TL, Binder-Scholl G, et al. Decade-long safety and function of retroviral-modified chimeric antigen receptor T cells. Sci Transl Med. 2012;4(132):132ra53. - PMC - PubMed
    1. Dudley ME, Rosenberg SA. Adoptive-cell-transfer therapy for the treatment of patients with cancer. Nat Rev Cancer. 2003;3(9):666–675. - PMC - PubMed

Publication types

MeSH terms

Associated data