. 2014 May 1;509(7498):43-8.
doi: 10.1038/nature13276.

Presynaptic inhibition of spinal sensory feedback ensures smooth movement

Affiliations

Presynaptic inhibition of spinal sensory feedback ensures smooth movement

Andrew J P Fink et al. Nature. .

Abstract

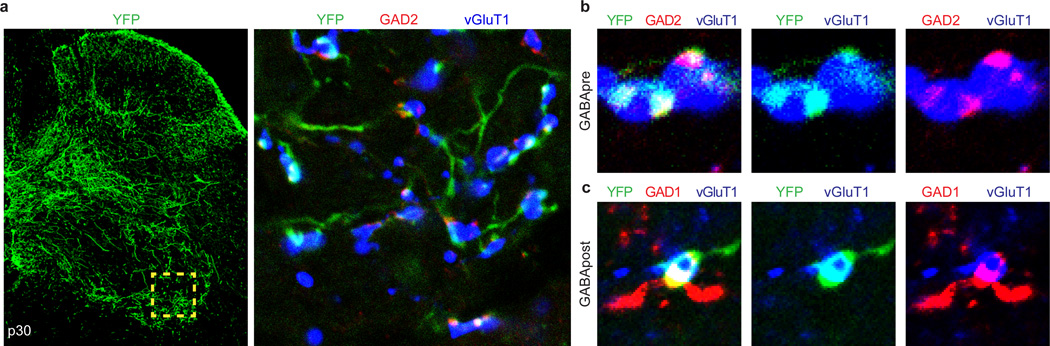
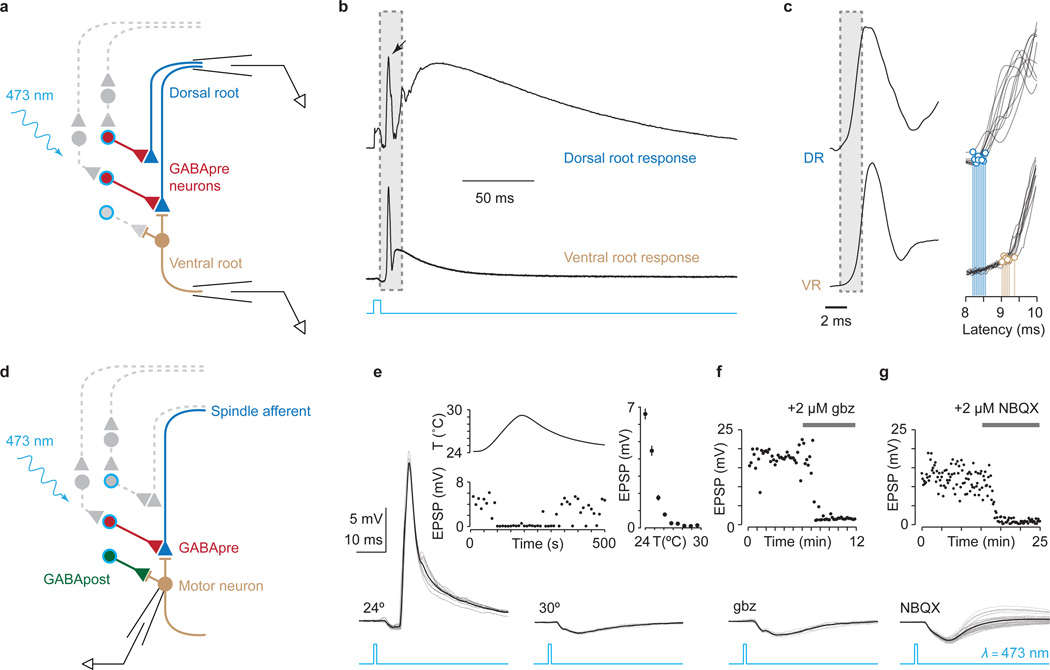
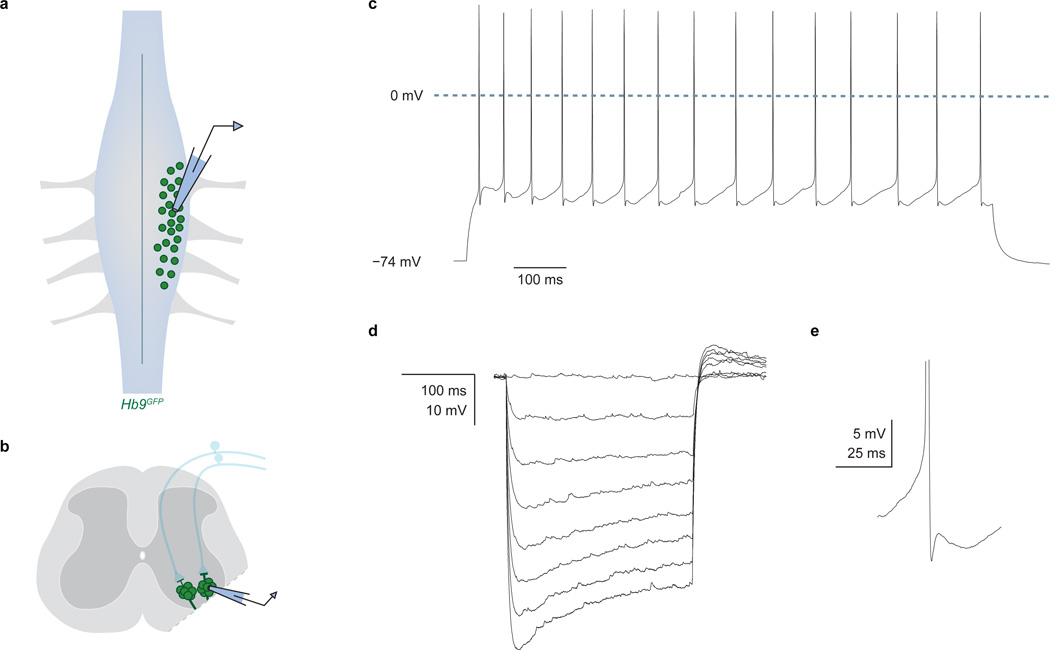
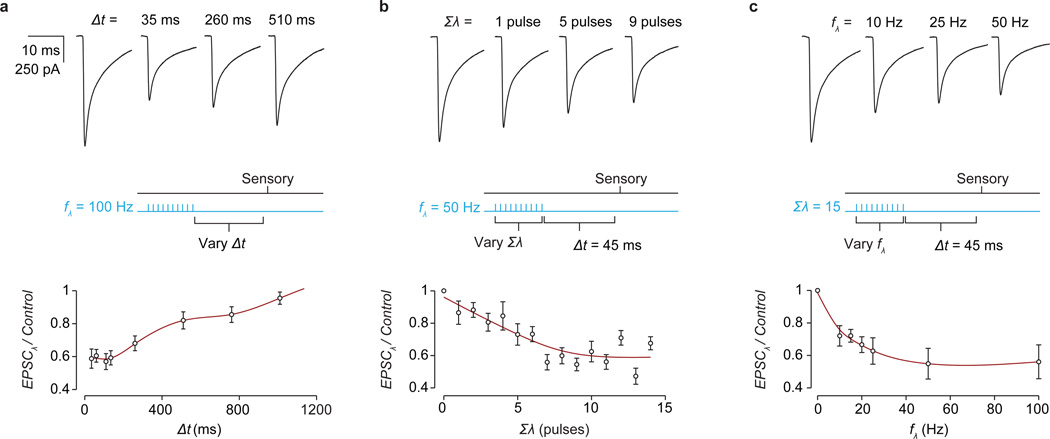
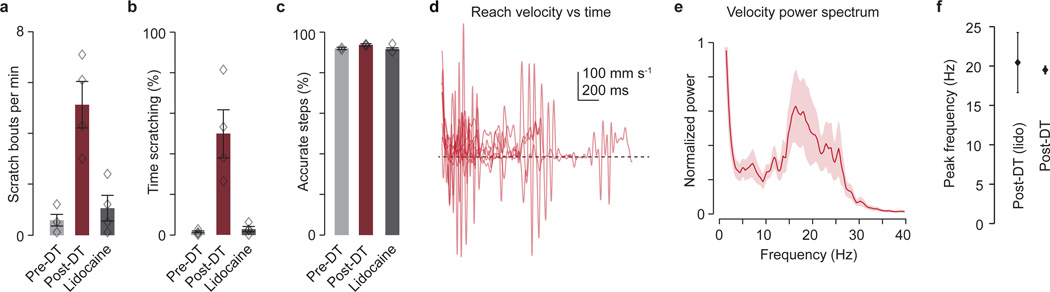
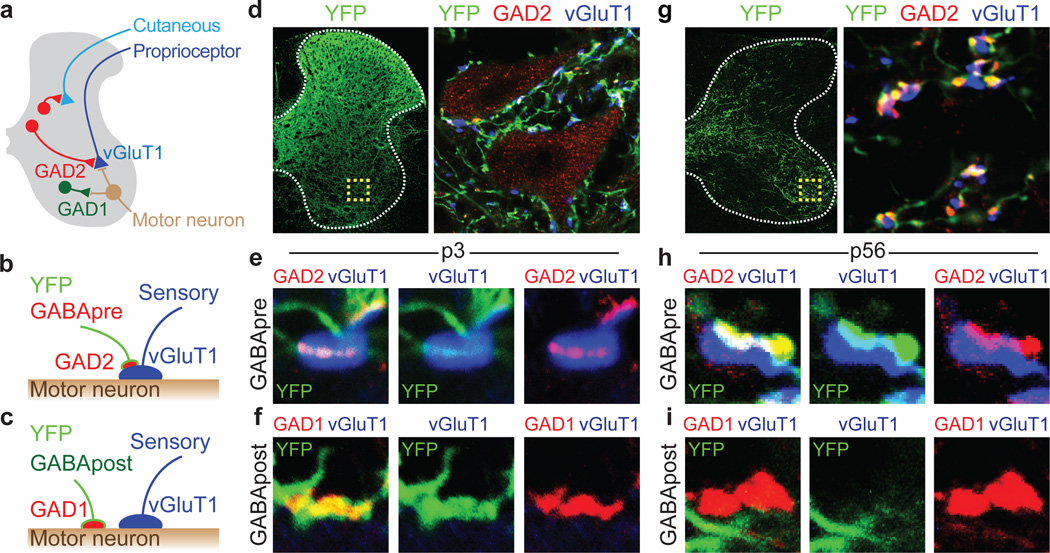
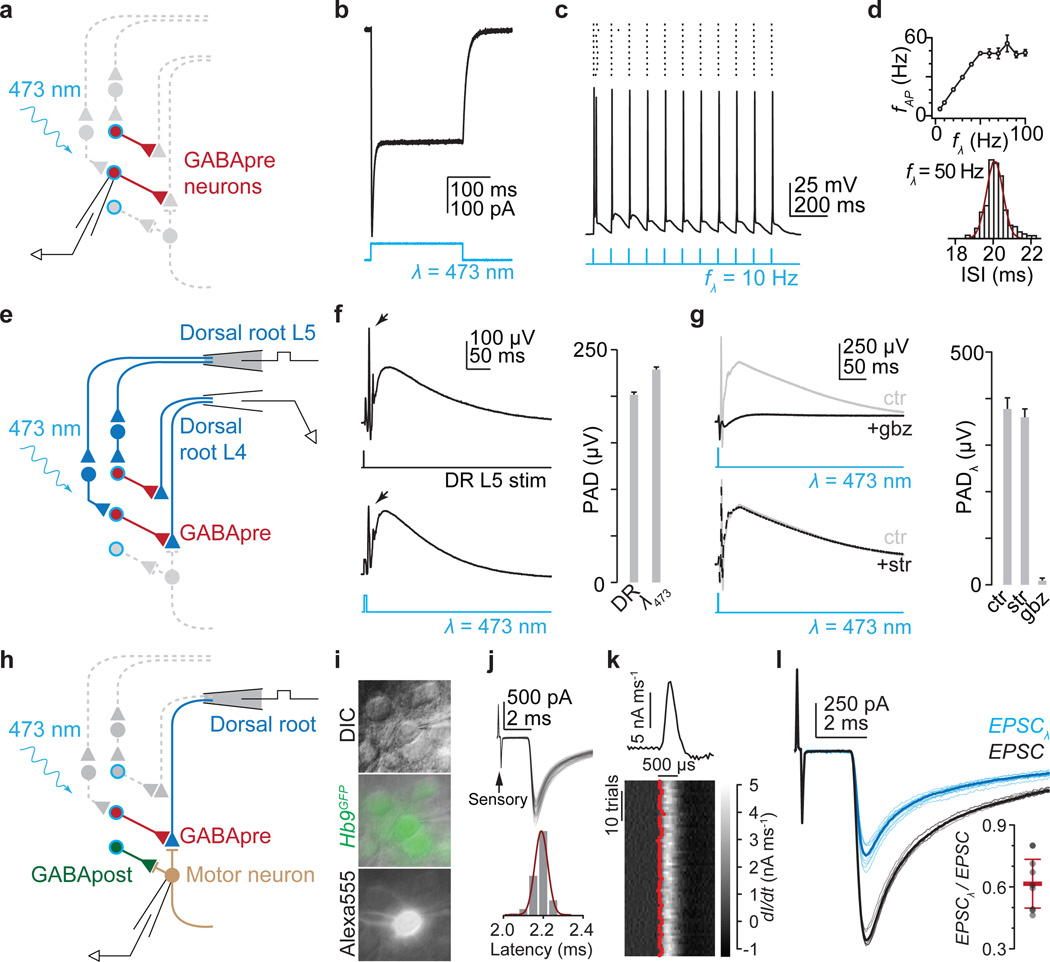
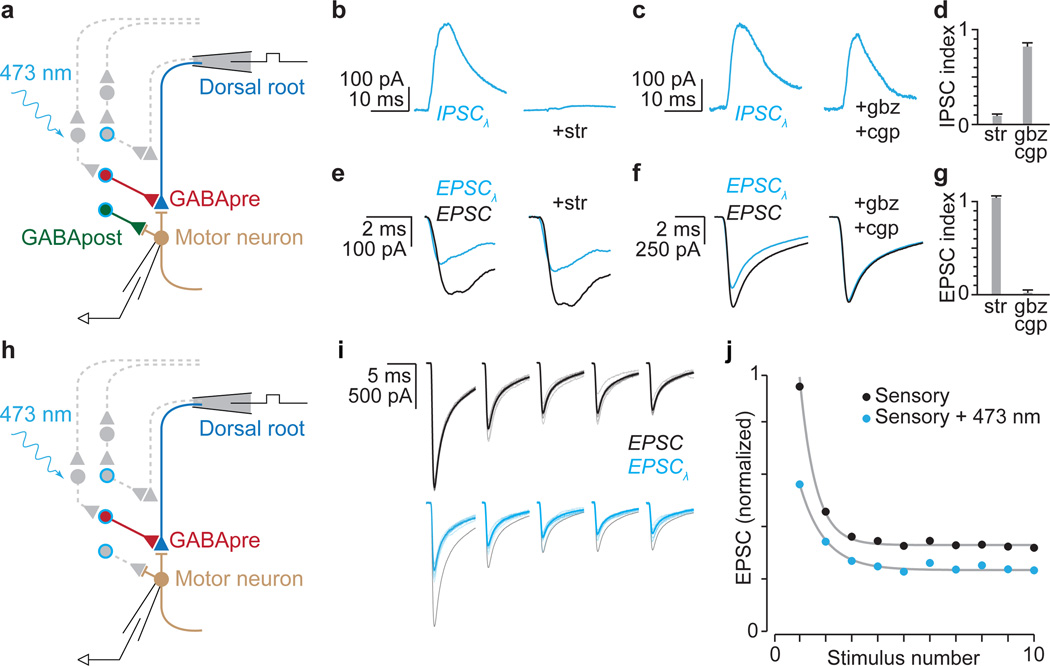
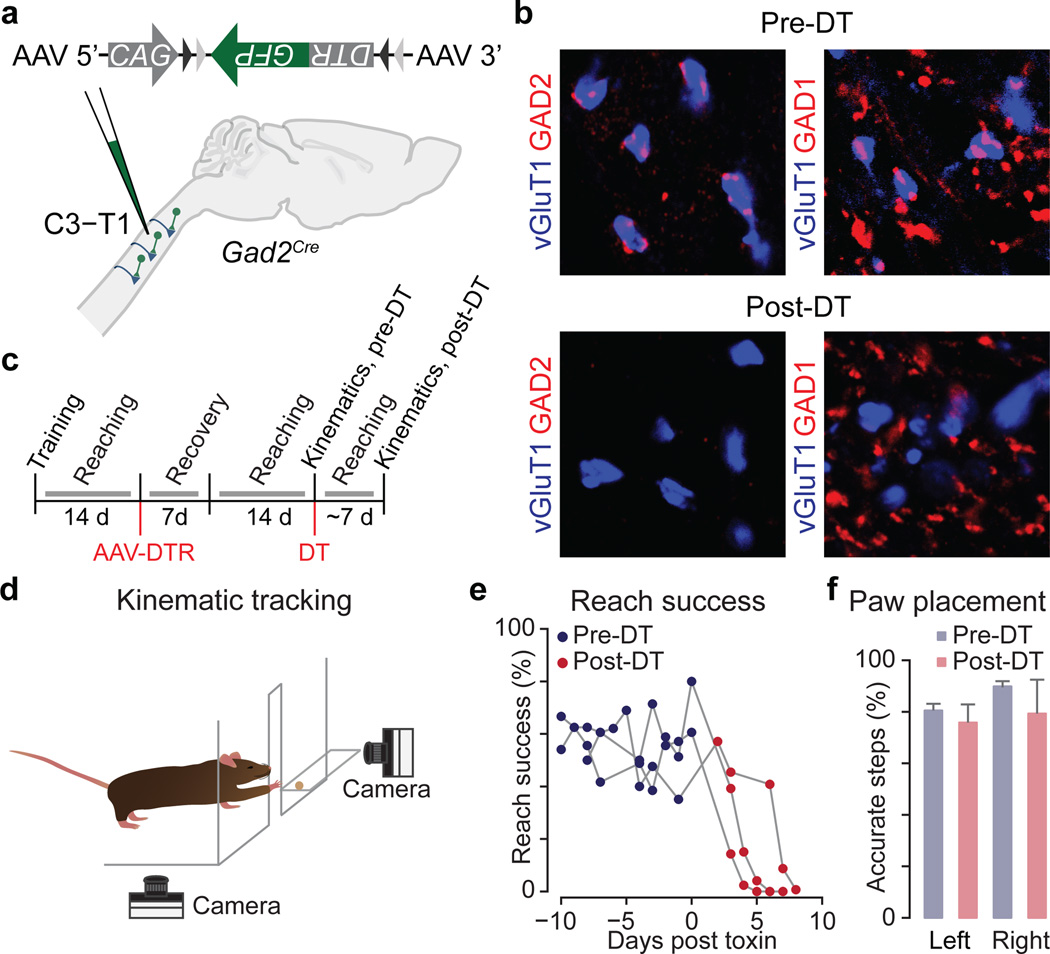
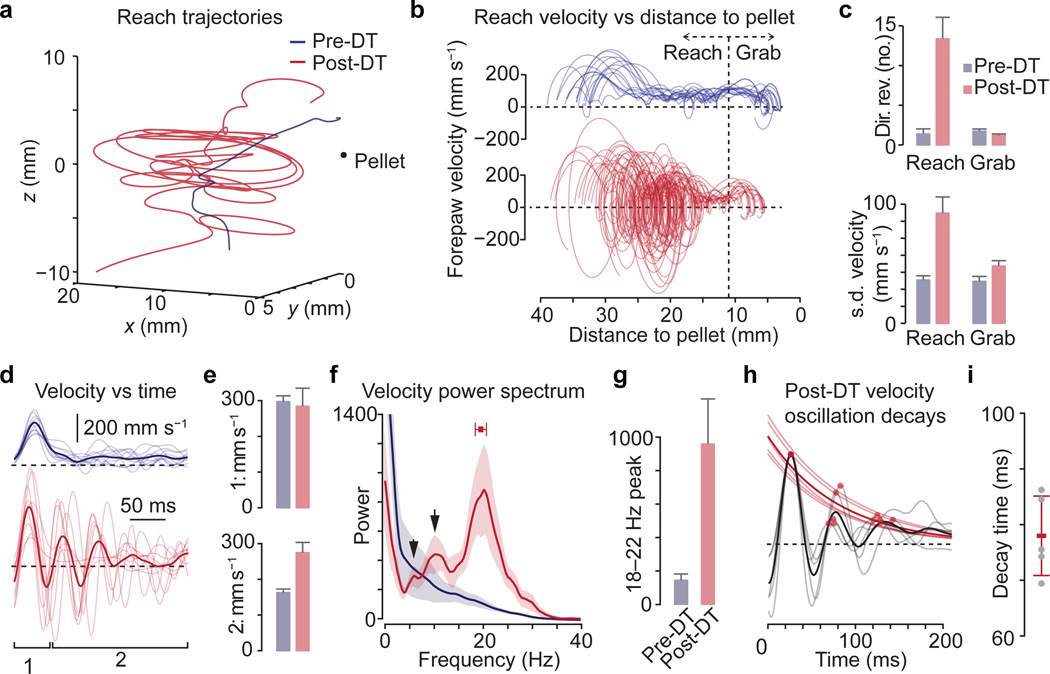
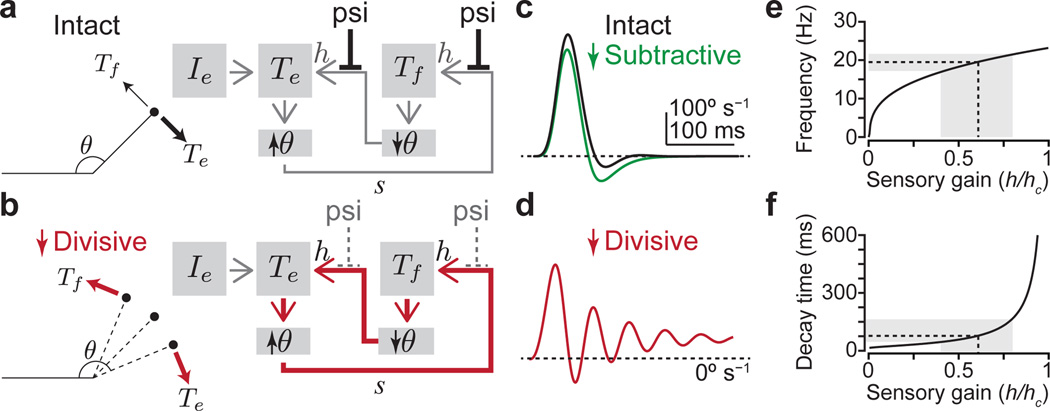
The precision of skilled movement depends on sensory feedback and its refinement by local inhibitory microcircuits. One specialized set of spinal GABAergic interneurons forms axo-axonic contacts with the central terminals of sensory afferents, exerting presynaptic inhibitory control over sensory-motor transmission. The inability to achieve selective access to the GABAergic neurons responsible for this unorthodox inhibitory mechanism has left unresolved the contribution of presynaptic inhibition to motor behaviour. We used Gad2 as a genetic entry point to manipulate the interneurons that contact sensory terminals, and show that activation of these interneurons in mice elicits the defining physiological characteristics of presynaptic inhibition. Selective genetic ablation of Gad2-expressing interneurons severely perturbs goal-directed reaching movements, uncovering a pronounced and stereotypic forelimb motor oscillation, the core features of which are captured by modelling the consequences of sensory feedback at high gain. Our findings define the neural substrate of a genetically hardwired gain control system crucial for the smooth execution of movement.


Figures

Extended Data Figure 1
Extended Data Figure 1. Genetic targeting of GABApre neurons in lumbar spinal cord
a, At late ages (p30) FLEX-ChR2-YFP lumbar injection in Gad2Cre mice marks GABApre neurons. In ventral horn (yellow box): YFP+/GAD2+ GABApre boutons contact vGluT1+ proprioceptor terminals (b, high resolution); YFPOFF/GAD1+ GABApost boutons do not contact vGluT1+ terminals. In contrast, a single YFP+/GAD1+ bouton is in contact with a vGluT1+ terminal and is, therefore, a GABApre bouton. p30 injection marks GABApre boutons (75.8 ± 3.3%) but not GABApost boutons (0.99 ± 0.02%; n = 2). Values and error bars indicate mean ± s.e.m.
Extended Data Figure 2
Extended Data Figure 2. Light-evoked excitation of spinal motor neurons reflects Gad2Cre neuron-mediated proprioceptor depolarization
a, Recordings from dorsal and ventral roots during Gad2Cre neuron photostimulation at 24–26°C. b, Light pulses induced primary afferent depolarization (top), accompanied by antidromic action potentials (black arrow), in dorsal roots shortly followed by orthodromic discharge in ventral roots (bottom). Outline indicates region shown in c. As shown in Fig. 2f, the time course and amplitude of PAD evoked by sensory stimulation and Gad2Cre-neuron photostimulation are similar. Sensory-PAD: amplitude 203 ± 2 µV; 10%–90% rise time 18.8 ± 0.3 ms; 10%–90% decay time 275.7 ± 8.3 ms; n = 10 trials; Gad2Cre-evoked PAD: amplitude 230 ± 1 µV; 10%–90% rise time 17.3 ± 0.3 ms; 10%–90% decay time 186.6 ± 2.0 ms. c, Mean antidromic spike recorded in dorsal root (top) and orthodromic spike recorded in ventral root (bottom). The latencies of spike onset (outlined region) are shown on the right (dorsal root spike onsets, blue circles; ventral root spike onsets, brown circles; vertical lines, latencies from light pulse onset). Ventral root spike onset was consistently later than dorsal root spike onset (mean delay 0.73 ± 0.03 ms; mean dorsal root spike latency 8.01 ± 0.42 ms; mean ventral root spike latency 8.74 ± 0.40 ms; two-tailed paired t test, P < 0.05, n = 2 preparations), indicating that light-evoked spikes occur in sensory neurons prior to motor neurons. d, Whole-cell patch-clamp recording from spinal motor neurons during Gad2Cre neuron photoactivation. e, Light-induced EPSPs (1 ms pulses) evoked at 24° (left) but not 30°C (right). Inset, left, temperature dependence of light-evoked EPSPs (top plot, bath temperature; bottom plot, EPSP amplitudes; both plotted as functions of time). Inset, right, average EPSP amplitude as a function of bath temperature. f, During low temperature (24–26°C) recording conditions, application of the GABA-A receptor antagonist gabazine (SR 95531, gbz, 2 µM) abolishes light-evoked EPSPs but leaves the glycinergic light-evoked IPSP intact. Inset, individual light-evoked EPSP amplitudes during gabazine application (grey bar). g, During low temperature (24–26°) recording conditions, application of the AMPA-receptor antagonist NBQX (2 µM) abolishes the fast, high-amplitude component of the light-evoked EPSP but does not affect the light-evoked IPSP. Inset, individual EPSP amplitudes during NBQX application (grey bar). Together these experiments are consistent with the view that synchronous activation of Gad2Cre neurons at low temperature depolarizes sensory afferent terminals with sufficient strength to generate sensory action potentials and subsequent glutamate release, in turn activating motor neurons (Supplementary Note 2). Values and error bars indicate mean ± s.e.m.
Extended Data Figure 3
Extended Data Figure 3. Physiological identification of spinal motor neurons
a, Whole-cell patch-clamp recording from spinal motor neurons in a whole (or hemisected) cord, in which motor neurons were targeted via visual guidance using GFP expression in Hb9GFP mice. b, Removal of the ventral-lateral white matter permits visual identification and access to spinal motor neurons without disrupting sensory-motor or interneuron circuitry. c–e, Motor neurons recorded in this configuration exhibit physiological properties typically associated with spinal motor neurons: c, current injection elicits repetitive action potentials, with rate adaptation; d, hyperpolarizing current steps reveal membrane potential sag, indicative of Ih current; and e, the waveform of motor neuron action potentials exhibits an early hyperpolarization indicative of an IA current and a prolonged hyperpolarization likely mediated by a calcium-activated IK(Ca) current.
Extended Data Figure 4
Extended Data Figure 4. Gad2Cre neuron photoactivation scales sensory EPSC amplitude
a, Sensory-evoked EPSCs evoked in motor neurons at varying delays (Δt) between the cessation of photostimulation (ten 1 ms pulses, 100 Hz, blue line) and sensory stimulation (black line). Fractional EPSC amplitude (EPSCλ/Control) plotted as a function of sensory delay Δt. Maximal EPSC suppression was seen at the smallest Δt values. Plot depicts fractional EPSC amplitude for Δt = 35, 60, 110, 135, 260, 510, 760 and 1010 ms. b, Sensory-evoked EPSCs following a varying number of light pulses (Σλ, blue line) at a fixed latency (Δt = 45 ms) recruits Gad2Cre neuron-evoked EPSC suppression of increasing magnitude. Plot depicts fractional EPSC amplitude for Σλ = 1–14 pulses. c, Sensory-evoked EPSCs following varying Gad2Cre neuron photoactivation frequency (fλ, blue line) at a fixed sensory delay (Δt = 45 ms) recruits increasing suppression of sensory-EPSCs. Plot depicts fractional EPSC amplitude for fλ = 10, 15, 20, 25, 50 and 100 Hz. These data, along with the linear scaling of Gad2Cre neuron firing with photoactivation frequency (Fig. 2d), indicate that the graded suppression of sensory-EPSCs is a consequence of increased spiking in Gad2Cre neurons. Red curves indicate splines fit to the data. Error bars indicate mean ± s.d. We note that these experiments require effective control of Gad2Cre neuronal spiking. As shown in Fig. 2b–d, light pulses induced pronounced currents and reliable spiking in ChR2-YFP+ Gad2Cre neurons (Vholding −60 mV; peak 773 ± 268 pAmp; steady state 537 ± 193 pAmp; 10%–90% rise time 2.1 ± 0.4 ms; 10%–90% decay time 33.5 ± 4.3 ms; n = 3). Values indicate mean ± s.e.m.
Extended Data Figure 5
Extended Data Figure 5. Postsynaptic inhibition cannot account for the observed reduction in sensory-evoked EPSC amplitude
a, Motor neuron IPSC elicited by a 1 ms light pulse. IPSCs had a 10%–90% decay time of 23.7 ± 1.9 ms and a mean peak amplitude of 299 ± 20 pAmp at −60 mV holding potential (n = 9). IPSCs reversed at ~−65 mV (Nernst equation predicts ECl = −67.5 mV). b, A 45 ms delay between the light pulse (blue) and electrical sensory stimulation pulse (black) permits the GABApost-mediated IPSC to decay almost completely before sensory-EPSC onset. c, Gad2Cre neuron-evoked IPSCs are monosynaptic. Red circles indicate estimated onset times with distribution of individual IPSC latencies shown in inset. Mean IPSC onset latency 2.4 ± 0.3 ms; cvonset 0.03 ± 0.007; n = 5. As shown in Fig. 3b–d, IPSCs are almost completely blocked by strychnine (str), with only limited effects of GABA receptor antagonists (gbz/cgp). IPSC index, ratio of IPSC amplitude with drug to control IPSC (str 0.09 ± 0.02, two-tailed paired t test, P < 10−5, n = 5; gbz/cgp 0.82 ± 0.04, P < 0.05, n = 3). Moreover, as shown in Fig. 3e,f, the Gad2Cre neuron-evoked suppression of sensory-evoked EPSCs is unaffected by strychnine (str) but abolished by co-application of the GABA-A and -B receptor antagonists SR 95531 and CGP54626. (EPSC index, drug has no effect = 1; drug abolishes EPSC-suppression = 0; str 1.04 ± 0.02, two-tailed paired t test, P = 0.3, n = 3; gbz/cgp 0.02 ± 0.03, two-tailed paired t test, P < 0.02, n = 4; see Methods). d, Sensory-evoked EPSC (black trace, control) and EPSCλ (blue trace, with Gad2Cre photoactivation) waveforms fit with double exponential function (EPSCfit, dashed lines, red) of the form EPSCfit(t) = A1 exp(−t1) + A2 exp(−t2). e, Distribution of the fast decay time constant (τ1) is similar for EPSC (black circles) and EPSCλ (blue circles) waveforms (EPSC mean τ1 96 ± 13 µs; EPSCλ τ1 89 ± 14 µs; n = 100 trials). f, Distribution of the slow decay time constant (τ2) is similar for EPSC and EPSCλ waveforms (EPSC mean τ2 5.56 ± 0.41 ms; EPSCλ τ2 5.41 ± 0.48 ms). g, Estimation of the 20%–80% rise and decay time provides an independent measure of EPSC kinetics. h, The 20–80% rise time for control EPSCs (EPSC 199 ± 7 µs) and that of EPSCs evoked following photoactivation (EPSCλ 197 ± 9 µs). i, The 20%–80% decay time for control EPSCs (EPSC 7.0 ± 0.5 ms) and that of EPSCs evoked following photoactivation (EPSCλ 7.3 ± 0.6 ms). j, Normalization of the light-conditioned EPSCλ waveform to the unconditioned EPSC waveform permits estimation of waveform correlation as a further metric of the similarity of the two waveforms (Pearson’s correlation, R > 0.999, P < 0.0001). The unaltered time course of the EPSC waveform argues against light-evoked EPSC suppression mediated by a postsynaptic inhibitory conductance. Although in theory a postsynaptic inhibitory conductance should have no effect on the current waveform of a perfectly clamped EPSC, the large size and low input resistance of the motor neurons, as well as the dendritic nature of the majority of sensory inputs, makes it likely that the voltage clamp is insufficient to prevent some depolarization of the dendrites, which would be altered via inhibitory conductance. In support of this idea the time course of EPSP waveforms recorded in current clamp are unaltered by photoactivation of Gad2Cre neurons under the conditions described here (data not shown). Values and error bars indicate mean ± s.d.
Extended Data Figure 6
Extended Data Figure 6. Estimation of release probability using mean variance analysis validates the short-term depression model
a, Amplitudes of 225 EPSPs recorded from a spinal motor neuron evoked by sensory stimulation across five calcium concentrations (0.5 mM, 1.0 mM, 1.5 mM, 2.0 mM and 4.0 mM) exhibiting fluctuating amplitudes due to calcium-controlled changes in transmitter release probability. EPSPs were recorded at each calcium concentration (0.1 Hz sensory stimulation frequency) once EPSP amplitude had settled to a steady value. Each calcium concentration was visited twice in sequence per recording. Data were collected in current clamp to reduce possible confounds due to changes in series resistance over the long recordings required to collect the data. b, EPSP variance versus amplitude (black circles) is well fit by a quadratic function (grey line) of the form σ2 = Aμ + Bμ2, where σ2 is the variance across EPSPs and μ is the mean EPSP amplitude for each calcium condition. The release probability (prel) is given by prel = μ (B/A) (1+cvq2) where cvq is the coefficient of variation in EPSP amplitude from a single release site. We set cvq = 0.3, following accepted values. Using this method, we found that for the representative neuron shown here prel = 0.97, 0.86, 0.66, 0.35 and 0.07 for [Ca2+]o = 4 mM, 2 mM, 1.5 mM, 1 mM and 0.5 mM, respectively. c, At each calcium concentration EPSP depression was monitored via repetitive stimulation of the dorsal root (10 pulses, 10 Hz). Shown here are five consecutive EPSPs for three calcium concentrations (1.5 mM, 1.0 mM and 0.5 mM; superposition of ten trials). d, Changes in EPSP depression as a function of calcium concentration were quantified using a model of short-term depression, (see Fig. 3h–j). The short-term depression model was set to generate EPSP amplitudes that depressed at different rates because of changes to the release probability term of the model. These EPSP amplitudes were fit by exponential functions. Normalized mean EPSP amplitudes at different calcium concentrations (circles) were then superimposed upon the curves generated by the short-term depression model (grey lines). The depression shown here is captured by setting the release probability parameters in the model to 0.52, 0.30 and 0.07 for [Ca2+]o = 1.5 mM, 1.0 mM and 0.5 mM respectively, which are in good correspondence with the release probability terms estimated using mean-variance analysis. For [Ca2+]o > 1.5 mM the short-term depression model consistently produced lower estimates for release probability than the mean variance analysis. But the correspondence at 1.5 mM and below argues for the short-term depression model being an effective means of capturing changes in release probability at sensory-motor synapses.
Extended Data Figure 7
Extended Data Figure 7. Reach trajectories before and after ablation of GABApre neurons
a, Pre-DT reach trajectories for four mice. Two dimensional paw trajectories were generated by projecting the three dimensional trajectory into the x-z plane. Green traces represent pre-DT hits, blue traces pre-DT misses. The asterisk indicates the location of the target food pellet. b, Post-DT two dimensional reach trajectories for the same mice, red traces. These mice were used for all kinematic quantification included in Extended Data Table 1.
Extended Data Figure 8
Extended Data Figure 8. Fitting the model to the frequency and decay time of post-DT reach velocity oscillations
a, To fit the model parameters to the experimentally derived frequency and decay times, we took advantage of the fact that the product of the oscillatory frequency and decay time (foscτosc) creates a parameter free value ncycle, which does not depend on the muscle time constant. The term ncycle corresponds to the number of oscillatory cycles per decay time constant and scales as a function of feedback gain. Plotting ncycle as a function of feedback gain (h/hc, where hc is the critical gain above which oscillations do not decay) permits estimation of the gain value that corresponds to the experimentally derived value of ncycle. Importantly, the corresponding gain value does not depend on the drag parameter k (inset and grey shading beneath black curve). Varying k by 100-fold results in minimal changes in the corresponding gain, with h/hc varying from 0.6 to 0.62. The grey curves represent the relationship between ncycle and h/hc across the full range of k values. Arrow indicates the gain value corresponding to the experimentally derived vale of ncycle for k = 0.5. See Supplementary Note 4 and Methods. b, To estimate the appropriate muscle time constant, we used the five dimensional matrix that defines the model (see Methods) to calculate the imaginary part of the complex eigenvalue corresponding to k = 0.5 and h/hc = 0.61. We found a time constant of τm = 9.6 ms (indicated by the arrow), which is within the range used in the original model based on experimentally-derived values. c, Introduction of delays in the feedback loop does not alter the basic properties of the model. Oscillation lifetime (τosc) as a function of absolute gain h for delays of 1 ms, 3 ms, 5 ms and 10 ms as compared to no delay (black trace). The vertical dashed lines indicate the gain level above which oscillations never decay (the critical gain, hc) for each delay value. d, Scaling these curves by their corresponding critical gain values reveals equivalent oscillatory lifetimes (h/hc). e, Oscillation frequency (fosc) as a function of normalized gain. As feedback delays increase, peak oscillatory frequency decreases. For higher delay conditions, where the oscillation frequency is significantly below 20 Hz, decreasing the muscle time constant results in higher oscillation frequencies. Thus for longer delays ~20 Hz oscillation is possible, but requires an increasingly small muscle time constant. f–h are as c–e but with three simultaneous loops of different delays (1 ms, 3 ms and 5 ms). In the presence of multiple simultaneous feedback delays the model continues to oscillate at a single dominant peak frequency for a given gain level. See Supplementary Note 5.
Extended Data Figure 9
Extended Data Figure 9. Lidocaine application abolishes scratching behavior but not reach oscillations, and does not affect forepaw stepping behavior
a, Scratching behavior increased following GABApre neuronal ablation, but was reduced to normal levels by topical application of lidocaine to the right forearm and paw. The rate of scratching bouts per 10 minute observation session increased following DT-administration, but returned to normal levels following lidocaine application (mean rate of scratch bouts per minute: pre-DT 0.6 ± 0.2 min−1; post-DT 5.1 ± 0.9 min−1; post-DT plus lidocaine 1.0 ± 0.5 min−1; pre-DT versus post-DT, P < 0.05; post-DT versus post-DT + lidocaine, P < 0.05, n = 4). b, Similarly, the percent time spent scratching during a 10 minute observation period is normally low (pre-DT 1.6 ± 0.4%) but increased following DT-administration (post-DT 49.8 ± 11.7%) and trended toward baseline after lidocaine application (post-DT plus lidocaine 2.9 ± 1.3%). Pre-DT versus post-DT, two-tailed paired t test, P < 0.05; post-DT versus post-DT + lidocaine, P = 0.06, n = 4. c, Stepping success rate on the horizontal ladder task. Lidocaine did not affect stepping performance (pre-DT 90 ± 1%; post-DT 93 ± 1%; post-DT + lidocaine 92 ± 1%; two-tailed paired t test; pre-DT versus post-DT, P = 0.7; post-DT versus post-DT + lidocaine, P = 0.6, n = 3). The equivalent rate of accuracy across conditions indicates that lidocaine application has no overt effect on forepaw placement during stepping. As shown in Fig. 4f, right and left forepaw placement accuracy pre-DT versus post-DT were similar (right paw: pre-DT 90.2 ± 2.0%; post-DT 79.6 ± 13.2%; two-tailed paired t test, P = 0.41; left paw: pre-DT 80.8 ± 2.7%; post-DT 76.1 ± 6.9%; two-tailed paired t test, P = 0.34, n = 4.) In contrast to stepping accuracy, as shown in Fig. 4e, reach success degraded following GABApre ablation as compared to control mice (pre-DT 48.6 ± 3.7%; post-DT 4.9 ± 4.7%; two-way repeated-measures ANOVA, interaction of group × toxin: F1,6 = 17.64, P = 0.006; post-hoc Bonferroni test, DTR: P < 0.01, n = 4 DTR, n = 4 control). d, Post-DT velocities of individual reaches continued to exhibit oscillation following topical lidocaine application. e, Power spectrum of post-DT reaches following lidocaine application (n = 2 mice, 14 reaches; shaded area, s.d.). f, Mean dominant frequency peak for post-DT reaches with lidocaine (20.5 ± 3.8 Hz) and without lidocaine (19.5 ± 0.5 Hz; see Fig. 5f,g). The persistence of limb oscillation during lidocaine block implicates a loss of proprioceptive rather than cutaneous presynaptic inhibition as the origin of the oscillation uncovered by GABApre neuronal ablation. Values and error bars indicate mean ± s.e.m.
Figure 1
Figure 1. Genetic targeting of GABApre neurons
a, GABApre contacts on sensory terminals; GABApost contacts on motor neurons. b, GABApre: GAD2+/GAD1+ boutons on vGluT1+ proprioceptor terminals. c, GABApost: GAD2OFF/GAD1+ boutons not on vGluT1+ terminals. d–f, p3 FLEX-ChR2-YFP lumbar injection in Gad2Cre mice. d, Ventral horn (box): YFP+/GAD2+ GABApre boutons contact vGluT1+ proprioceptor terminals (e, high resolution); YFP+/GAD1+ GABApost boutons do not contact vGluT1+ terminals (f). p0–3 injection marks GABApre (85.2 ± 2.1%) and GABApost (57.3 ± 3.4%; n = 3) boutons. g–i, p56 FLEX-ChR2-YFP cervical injection in Gad2Cre mice. g, Ventral horn (box): YFP+/GAD2+ GABApre boutons contact vGluT1+ terminals (h); i, YFPOFF/GAD1+ GABApost bouton. p56–84 injection marks GABApre (77.6 ± 8.5%) but not GABApost boutons (1.0 ± 0.1%; n = 2). Values and error bars, mean ± s.e.m.
Figure 2
Figure 2. Gad2Cre photoactivation elicits presynaptic inhibition
a, Recording from ChR2-YFP+ (blue outline) Gad2Cre neurons (red). b, Photostimulation (λ) induced currents and c, action potentials, d, whose frequency (fAP) followed light-pulse frequency (fλ) up to ~50 Hz (n = 3). e, Dorsal root stimulation (L5) and recording (L4). f, L5-evoked (top, DR) and light-evoked (bottom, λ473; n = 4) PAD. Arrows, antidromic spikes. g, Light-evoked PAD without (ctr) and with SR 95531 (gbz, 2 µM) or strychnine (str, 5 µM). Plots (f, g) show PAD amplitude. h, Isolating sensory input during Gad2Cre photoactivation. i, Motor neuron identified using DIC optics, Hb9GFP expression and Alexa555 fill. j, Monosynaptic sensory-EPSCs (90 trials, 10 Hz); onset latencies (Gaussian fit, red) estimated using, k, EPSC waveform derivative (top, mean; bottom, individual traces; EPSC onsets, red). Mean onset latency 2.87 ± 0.18 ms; cvonset 0.018 ± 0.002; n = 19. l, Sensory-EPSCs (0.1 Hz; mean, bold; raw, faint) without (EPSC, black) or with photoactivation (EPSCλ, blue; fifteen 1 ms pulses; 50 Hz; 45 ms delay). Inset, EPSC suppression; n = 9. Values and error bars, mean ± s.e.m., except l, mean ± s.d. See Extended Data Figs 2,4 for additional quantification.
Figure 3
Figure 3. GABApre photoactivation reduces sensory transmitter release
a, Distinguishing GABApre from GABApost inhibition. b–g, Pharmacological analysis: b–d, light-evoked (λ) IPSCs, b, strychnine (str; n = 5), c, SR 95531 (gbz; n = 3) and CGP 54626 (cgp, 2.5 µM; n = 3), d, IPSC index: ratio of IPSC amplitude with drug to control; e–g, Gad2Cre suppression of sensory-EPSCs (with photostimulation, blue; without, black), e, (str, n = 3), f, (gbz/cgp, n = 4), g, EPSC index: no effect = 1; drug abolishes EPSC-suppression = 0 (see Methods for description and Extended Data Fig. 5 for statistics). h, Isolation of GABApre inhibitory action. i, Sensory-EPSCs (10 pulses, 25 Hz; mean, bold; raw, faint) without (black) or with photostimulation (blue, black control superimposed for comparison). j, Normalized mean EPSC amplitudes from i. Grey, exponential fits to model-generated EPSC amplitudes. Values and error bars, mean ± s.e.m.
Figure 4
Figure 4. Selective GABApre ablation
a, After C3–T1 FLEX-DTR-GFP injection into adult Gad2Cre mice, b, GABApre boutons (GAD2+, red) contact proprioceptor terminals (vGluT1+, blue) pre- but not post-DT. Only GAD1-marked GABApost boutons remain post-DT. vGluT1+ boutons with GABApre contacts, pre-DT 88 ± 2% (n = 2,058 boutons in 4 mice); post-DT 9 ± 1% (n = 4,347 boutons in 3 mice). c, Experimental timeline. d, Reaching kinematics assay (see Methods). e, Reach success pre-DT and post-DT (3 mice shown). f, Stepping accuracy, horizontal ladder assay. Values and error bars, mean ± s.e.m. See Extended Data Fig. 9 and Extended Data Table 1 for statistics.
Figure 5
Figure 5. GABApre ablation uncovers limb oscillation during reaching
a, Reach trajectories and b, velocities from a representative mouse. Vertical line, reach versus grab phases. Horizontal line, forepaw direction reversals (also in d,h). c, Direction reversals and s.d. of velocity between reaches during reach and grab phases (n = 4 mice, 112 reaches). d, Paw velocity versus time from a second representative mouse. Mean, bold; individual reaches, faint. e, Peak reach velocities: initial (bracket ‘1’ in d) and subsequent (>50 ms, bracket ‘2’ in d). f, Mean power spectra of reach velocities; shaded area, s.e.m. Red box, mean frequency peak ± s.d. Arrows, subharmonic peaks. g, Peak power: 18–22 Hz (n = 5 mice, 132 reaches; see Methods). h, Peak-aligned averages within (grey) and across mice (black). Mean velocity peaks for each mouse (red dots) and exponential fits (faint red lines). Mean fit, bold red line,. i, Decay time constant across mice (mean ± s.d.; n = 5).Values and error bars, mean ± s.e.m., except where indicated. See Extended Data Table 1 for statistics.
Figure 6
Figure 6. GABApre neurons regulate sensory gain
a,b, Model of joint angle, θ, under the control of flexor Tf and extensor Te torques. External drive Ie activates Te, increasing θ (bold arrow). Sensory feedback s recruits a counteracting Tf with efficacy specified by sensory gain h. Presynaptic inhibition (psi) suppresses gain divisively, keeping Tf small (faint arrow, a). With reduced psi, high gain feedback induces alternating, sensory-driven Tf and Te (red arrows, b). c,d, Joint angle velocity over time for, c, intact (h/hc = 0.1) and reduced subtractive (postsynaptic) inhibition (green line, see Methods), and d, high gain (h/hc = 0.6, reduced divisive psi). For gains above the critical level (hc), oscillations do not decay. e, Oscillation frequency and, f, decay time versus gain. Grey boxes, range of gain values (h/hc = 0.4–0.8) corresponding to post-DT oscillation frequencies and decay times (Fig. 5d–i). Dashed lines, 19.5 Hz, 77 ms. See Supplementary Note 4.

Comment in

References

    1. Windhorst U. Muscle proprioceptive feedback and spinal networks. Brain Research Bulletin. 2007;73:155–202. - PubMed
    1. Arber S. Motor circuits in action: specification, connectivity, and function. Neuron. 2012;74:975–989. - PubMed
    1. Frank K, Fuortes M. Presynaptic and postsynaptic inhibition of monosynaptic reflexes. Federation Proceedings. 1957;16:49–50.
    1. Eccles JC, Eccles RM, Magni F. Central inhibitory action attributable to presynaptic depolarization produced by muscle afferent volleys. Journal of Physiology. 1961;159:147–166. - PMC - PubMed
    1. Lundberg A. Supraspinal control of transmission in reflex paths to motoneurones and primary afferents. Progress in Brain Research. 1964;12:197–221. - PubMed

Supplementary References

    1. Wichterle H, Lieberam I, Porter JA, Jessell TM. Directed differentiation of embryonic stem cells into motor neurons. Cell. 2002;110:385–397. - PubMed
    1. Shneider NA, Mentis GZ, Schustak J, O'Donovan MJ. Functionally reduced sensorimotor connections form with normal specificity despite abnormal muscle spindle development: the role of spindle-derived neurotrophin 3. Journal of Neuroscience. 2009;29:4719–4735. - PMC - PubMed
    1. Hantman AW, Jessell TM. Clarke's column neurons as the focus of a corticospinal corollary circuit. Nature Neuroscience. 2010;13:1233–1239. - PMC - PubMed
    1. Varela JA, et al. A quantitative description of short-term plasticity at excitatory synapses in layer 2/3 of rat primary visual cortex. Journal of Neuroscience. 1997;17:7926–7940. - PMC - PubMed
    1. Clements JD, Silver RA. Unveiling synaptic plasticity: a new graphical and analytical approach. Trends in Neurosciences. 2000;23:105–113. - PubMed

Publication types

MeSH terms

Substances