

Analysis of perceived similarity between pairs of microcalcification clusters in mammograms
- PMID: 24784383
- PMCID: PMC4000405
- DOI: 10.1118/1.4870959
Analysis of perceived similarity between pairs of microcalcification clusters in mammograms
Abstract
Purpose: Content-based image retrieval aims to assist radiologists by presenting example images with known pathology that are visually similar to the case being evaluated. In this work, the authors investigate several fundamental issues underlying the similarity ratings between pairs of microcalcification (MC) lesions on mammograms as judged by radiologists: the degree of variability in the similarity ratings, the impact of this variability on agreement between readers in retrieval of similar lesions, and the factors contributing to the readers' similarity ratings.
Methods: The authors conduct a reader study on a set of 1000 image pairs of MC lesions, in which a group of experienced breast radiologists rated the degree of similarity between each image pair. The image pairs are selected, from among possible pairings of 222 cases (110 malignant, 112 benign), based on quantitative image attributes (features) and the results of a preliminary reader study. Next, the authors apply analysis of variance (ANOVA) to quantify the level of variability in the readers' similarity ratings, and study how the variability in individual reader ratings affects consistency between readers. The authors also measure the extent to which readers agree on images which are most similar to a given query, for which the Dice coefficient is used. To investigate how the similarity ratings potentially relate to the attributes underlying the cases, the authors study the fraction of perceptually similar images that also share the same benign or malignant pathology as the query image; moreover, the authors apply multidimensional scaling (MDS) to embed the cases according to their mutual perceptual similarity in a two-dimensional plot, which allows the authors to examine the manner in which similar lesions relate to one another in terms of benign or malignant pathology and clustered MCs.
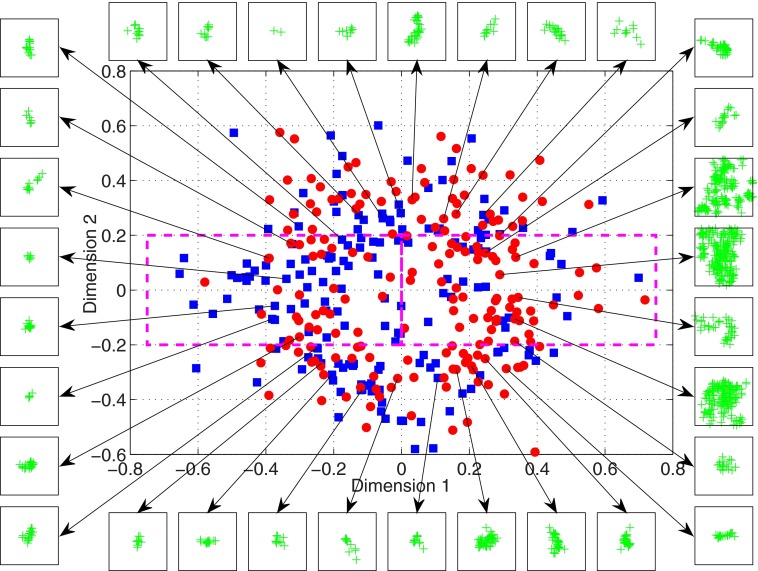
Results: The ANOVA results show that the coefficient of determination in the reader similarity ratings is 0.59. The variability level in the similarity ratings is proved to be a limiting factor, leading to only moderate correlation between the readers in their readings. The Dice coefficient, measuring agreement between readers in retrieval of similar images, can vary from 0.45 to 0.64 with different levels of similarity for individual readers, but is higher for average ratings from a group of readers (from 0.59 to 0.78). More importantly, the fraction of retrieved cases that match the benign or malignant pathology of the query image was found to increase with the degree of similarity among the retrieved images, reaching average value as high as 0.69 for the radiologists (p-value <10(-4) compared to random guessing). Moreover, MDS embedding of all the cases shows that cases having the same pathology tend to cluster together, and that neighboring cases in the plot tend to be similar in their clustered MCs.
Conclusions: While individual readers exhibit substantial variability in their similarity ratings, similarity ratings averaged from a group of readers can achieve a high level of intergroup consistency and agreement in retrieval of similar images. More importantly, perceptually similar cases are also likely to be similar in their underlying benign or malignant pathology and image features of clustered MCs, which could be of diagnostic value in computer-aided diagnosis for lesions with clustered MCs.
Figures


References
-
- Cancer Facts and Figures (American Chemical Society, Atlanta, GA, 2012).
-
- Kopans D. B., Breast Imaging, 3rd ed. (Williams and Wilkins, Baltimore, MD, 2007).
-
- Jiang Y., Nishikawa R. M., Schmidt R. A., Metz C. E., and Doi K., “Relative gains in diagnostic accuracy between computer-aide diagnosis and independent double reading,” Medical Imaging 2000: Image Perception and Performance (SPIE Press, Bellingham, WA, 2000), pp. 10–15.
Publication types
MeSH terms
Grants and funding
LinkOut - more resources
Full Text Sources
Other Literature Sources
Medical
Research Materials
Miscellaneous
