. 2014;9(6):1229-44.
doi: 10.1038/nprot.2014.100. Epub 2014 May 1.

3D mouse embryonic stem cell culture for generating inner ear organoids

Affiliations

3D mouse embryonic stem cell culture for generating inner ear organoids

Karl R Koehler et al. Nat Protoc. 2014.

Abstract

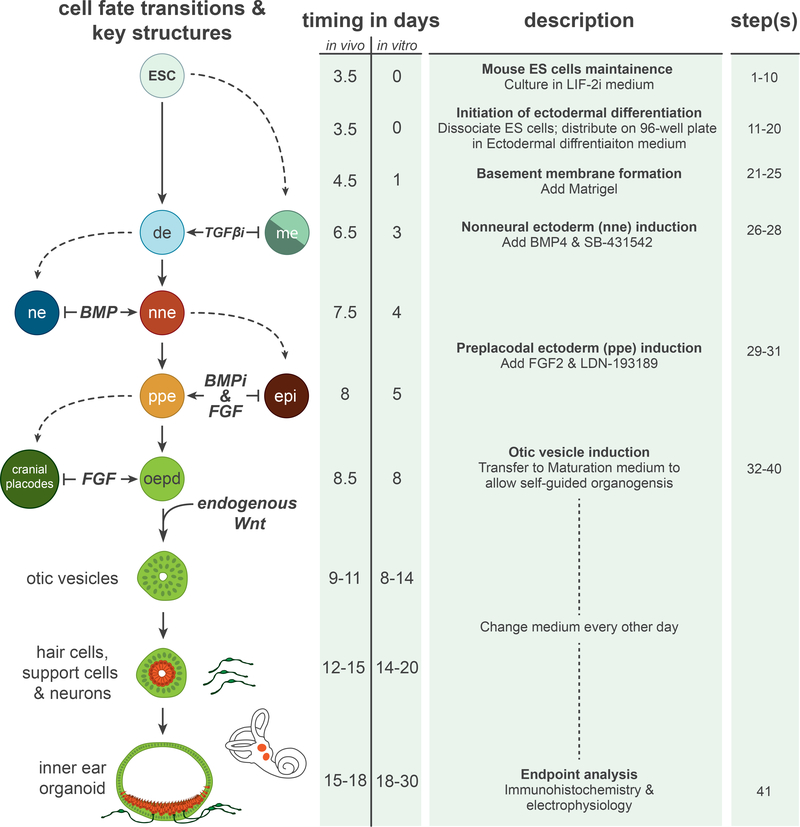
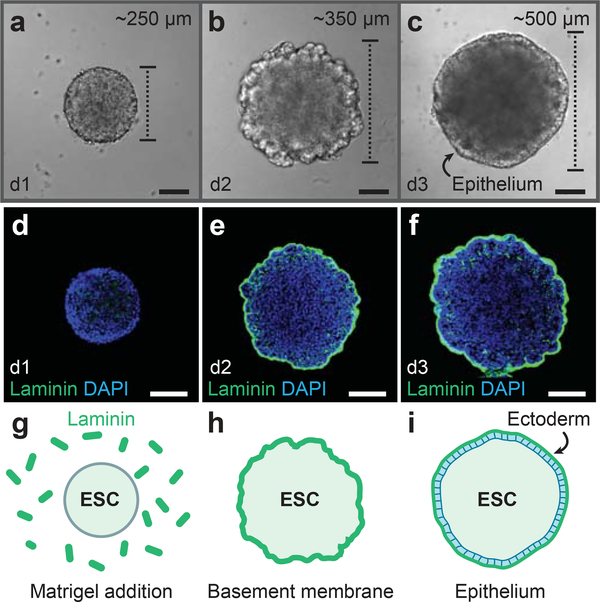
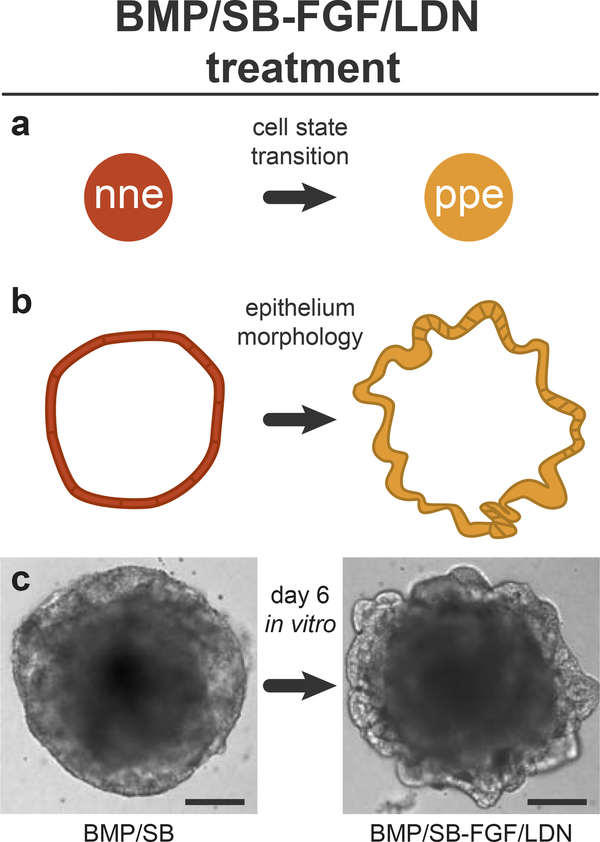
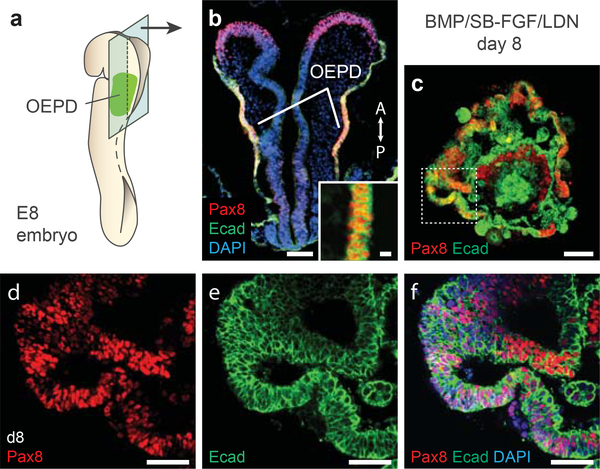
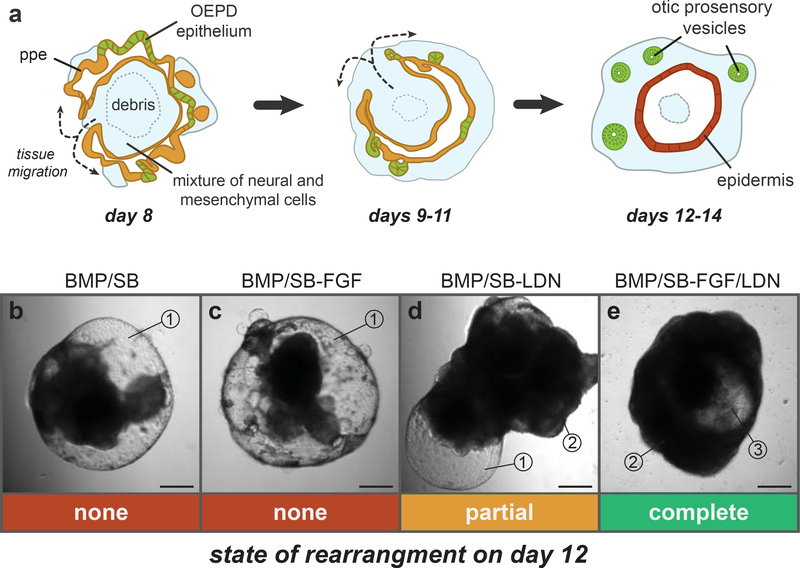
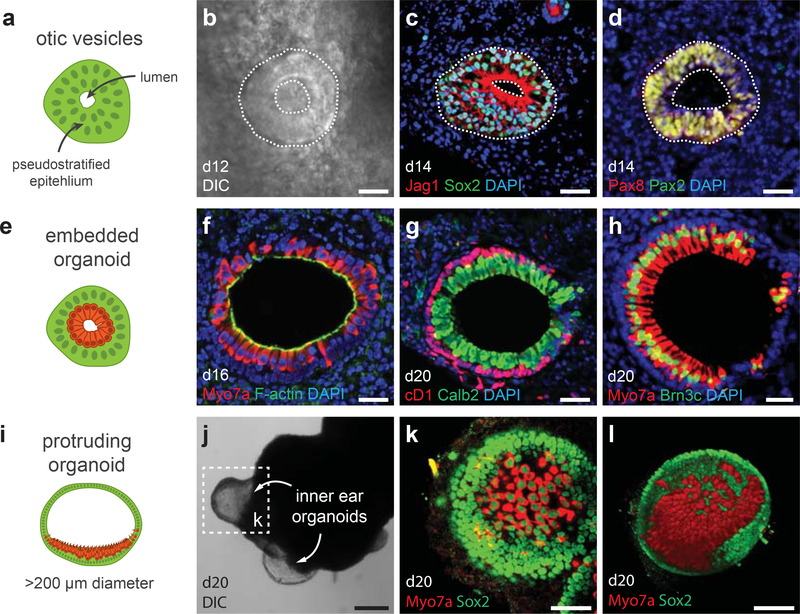
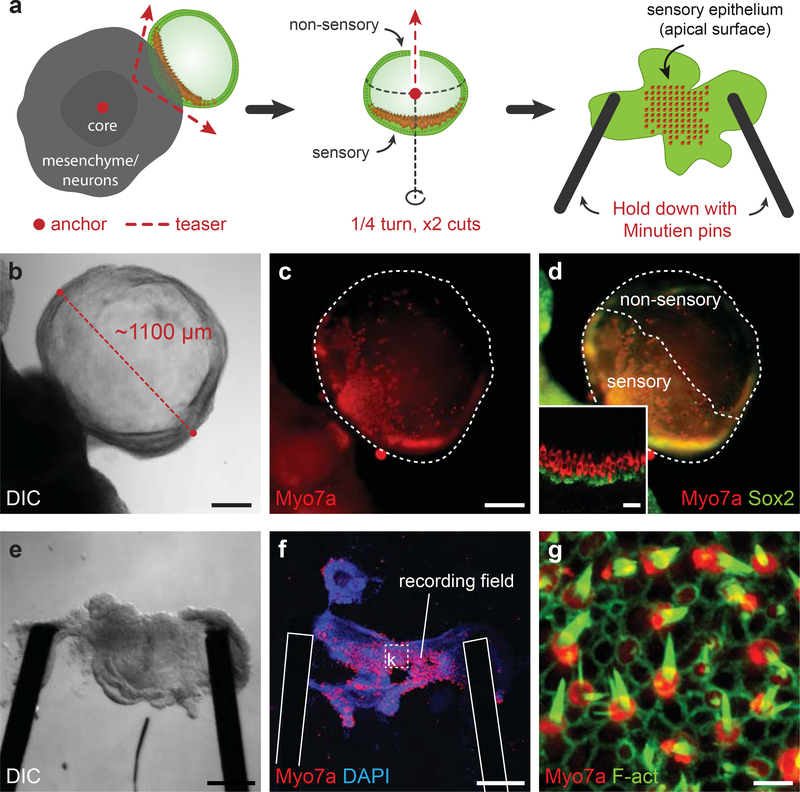
This protocol describes a culture system in which inner-ear sensory tissue is produced from mouse embryonic stem (ES) cells under chemically defined conditions. This model is amenable to basic and translational investigations into inner ear biology and regeneration. In this protocol, mouse ES cells are aggregated in 96-well plates in medium containing extracellular matrix proteins to promote epithelialization. During the first 14 d, a series of precisely timed protein and small-molecule treatments sequentially induce epithelia that represent the mouse embryonic non-neural ectoderm, preplacodal ectoderm and otic vesicle epithelia. Ultimately, these tissues develop into cysts with a pseudostratified epithelium containing inner ear hair cells and supporting cells after 16-20 d. Concurrently, sensory-like neurons generate synapse-like structures with the derived hair cells. We have designated the stem cell-derived epithelia harboring hair cells, supporting cells and sensory-like neurons as inner ear organoids. This method provides a reproducible and scalable means to generate inner ear sensory tissue in vitro.


Conflict of interest statement

Competing financial interests The authors declare no competing financial interests.

Figures

Figure 1:
Figure 1:. Overview of inner ear induction protocol.
A comparison of cell fate and morphological transitions that take place during in vivo and in vitro inner ear development. Note that the in vivo time points are approximate values derived from mouse developmental studies. Moreover, the cell fate transition model depicted in the left-hand column is a generalization of models derived from studies in various vertebrate species. The preplacodal fate, for instance, has not been as clearly defined in the mouse system as it has in the Xenopus, chick and zebrafish models. The right-hand column describes the experimental procedures and step numbers associated with each cell fate transition in the culture. ESC, embryonic stem cells; de, definitive ectoderm; nne, nonneural ectoderm; ne, neural ectoderm; me, mesendoderm; ppe, preplacodal ectoderm; epi, epidermis; oepd, otic-epibranchial placode domain.
Figure 2:
Figure 2:. Development of the definitive ectoderm epithelium.
a-c, DIC images of representative aggregates on days 1, 2, and 3 of 3D culture. d-i, Following Matrigel addition on day 1, Laminin is incorporated into a basement membrane (e, f, h, i) on the surface of the aggregate. An epithelium develops on the aggregate surface by day 3. See Table 1 for a list of antibodies used for characterization. ESC, embryonic stem cells. Scale bars, 100 μm
Figure 3:
Figure 3:. Morphology changes following BMP/SB-FGF/LDN treatment.
a, FGF/LDN treatment induces preplacodal ectoderm from nonneural ectoderm. b, c, The morphology of the nonneural ectoderm layer on the surface of the aggregates thickens and ruffles in response to FGF/LDN treatment. Scale bars, 100 μm
Figure 4:
Figure 4:. Aggregate organization on day 8 of differentiation.
a, b, The epithelium of the OEPD in an E8 mouse embryo and (c-f) the outer-epithelium of BMP/SB-FGF/LDN treated aggregates express Pax8 and Ecad. See Table 1 for a list of antibodies used for characterization. Panel b was previously published in Supplementary Figure 6 of Koehler et al. Nature 2013. All animal experiments were performed in accordance with the Indiana University Institutional Animal Care and Use Committee (IACUC) guidelines. Scale bars, 100 (b,c), 30 (d-f), and 10 (b-inset) μm.
Figure 5:
Figure 5:. Cellular rearrangement between days 8 and 12 of differentiation.
a, Schematic of the stages of rearrangement during days 8, 9–11 and 12–14. b-e, Day 12 aggregates that received treatment with BMP/SB (b), BMP/SB-FGF (c), BMP/SB-LDN (d) or BMP/SB-FGF/LDN (e). The numbered indicators denote key characteristics to look for when assessing the state of cellular rearrangement: 1) An outer-layer of translucent epithelium indicates the development of epidermis and improper cellular rearrangement, 2) an outer-layer of opaque tissue indicates rearrangement, 3) the appearance of a translucent central core indicates the proper migration of tissue to the outer-surface of the aggregate. Nascent otic vesicles should be visible in translucent regions similar to #3. No rearrangement is seen in panels b and c, partial rearrangement is seen in panel d and complete rearrangement in panel e. Panels a-e were adapted from Supplementary Figure 9 of Koehler et al. Nature 2013. Scale bars, 250 μm.
Figure 6:
Figure 6:. Hair cell induction and organoid types.
a, b, Otic vesicles can be seen using a conventional light microscope while aggregates are in culture. c, d, Otic vesicles express Jag1, Sox2, Pax2, and Pax8. e-l, There are two organoid variants: embedded (e-h) and protruding (i-l). The sensory epithelia of each inner ear organoids contain CyclinD1 (cD1)+ Sox2+ supporting cells and Myo7a+ Brn3c+ and Calretinin (Calb2)+ hair cells. i, j, Protruding organoids are typically >200 μm in diameter and are visible at low magnification or, occasionally, by the naked eye. See Table 1 for a list of antibodies used for characterization. Panels g and h were previously published in Supplementary Figure 13 of Koehler et al. Nature 2013. Scale bars, 250 (j), 100 (l), 50 (k), 25 (b-d) μm.
Figure 7:
Figure 7:. Inner ear organoid dissection for electrophysiological analysis.
a, A schematic of the organoid dissection method described in steps 62–72. The red dots and dotted lines with arrows refer the placement or motion that should be performed with two tungsten needles. b-d, Representative protruding organoid before dissection. e-g, Representative dissected sensory epithelium in an epithelium holder ready for experimentation. Post-recording immunostaining reveals the field of Myo7a+ hair cells with F-actin+ stereocilia from which electrophysiological recordings were taken. See Table 1 for a list of antibodies used for characterization. Panels b-g were previously published in Supplementary Figures 14 and 15 of Koehler et al. Nature 2013. Scale bars, 250 (b-f), 5 (g) μm.

References

    1. Sasai Y Cytosystems dynamics in self-organization of tissue architecture. Nature 493, 318–326 (2013). - PubMed
    1. Sasai Y, Eiraku M & Suga H In vitro organogenesis in three dimensions: self-organising stem cells. Development (Cambridge, England) 139, 4111–4121 (2012). - PubMed
    1. Koehler KR, Mikosz AM, Molosh AI, Patel D & Hashino E Generation of inner ear sensory epithelia from pluripotent stem cells in 3D culture. Nature 500, 217–221 (2013). - PMC - PubMed
    1. Gonzalez-Cordero A et al. Photoreceptor precursors derived from three-dimensional embryonic stem cell cultures integrate and mature within adult degenerate retina. Nature Biotechnology 31, 741–747 (2013). - PMC - PubMed
    1. Eiraku M et al. Self-organizing optic-cup morphogenesis in three-dimensional culture. Nature 472, 51–56 (2011). - PubMed

Publication types

MeSH terms

Substances