

Exploration of scanning effects in multi-site structural MRI studies
- PMID: 24785589
- PMCID: PMC4114231
- DOI: 10.1016/j.jneumeth.2014.04.023
Exploration of scanning effects in multi-site structural MRI studies
Abstract
Background: Pooling of multi-site MRI data is often necessary when a large cohort is desired. However, different scanning platforms can introduce systematic differences which confound true effects of interest. One may reduce multi-site bias by calibrating pivotal scanning parameters, or include them as covariates to improve the data integrity.
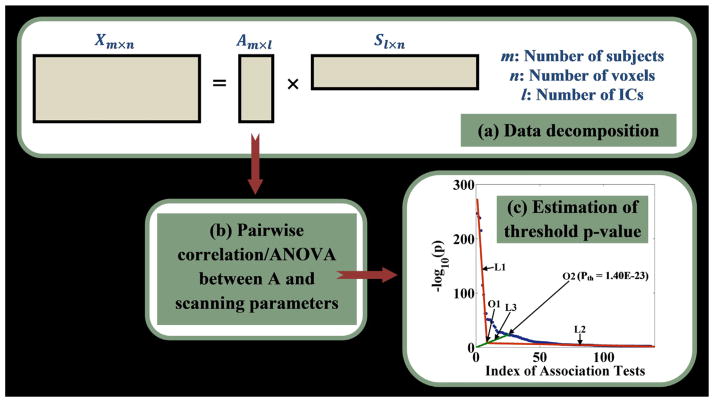
New method: In the present study we use a source-based morphometry (SBM) model to explore scanning effects in multi-site sMRI studies and develop a data-driven correction. Specifically, independent components are extracted from the data and investigated for associations with scanning parameters to assess the influence. The identified scanning-related components can be eliminated from the original data for correction.
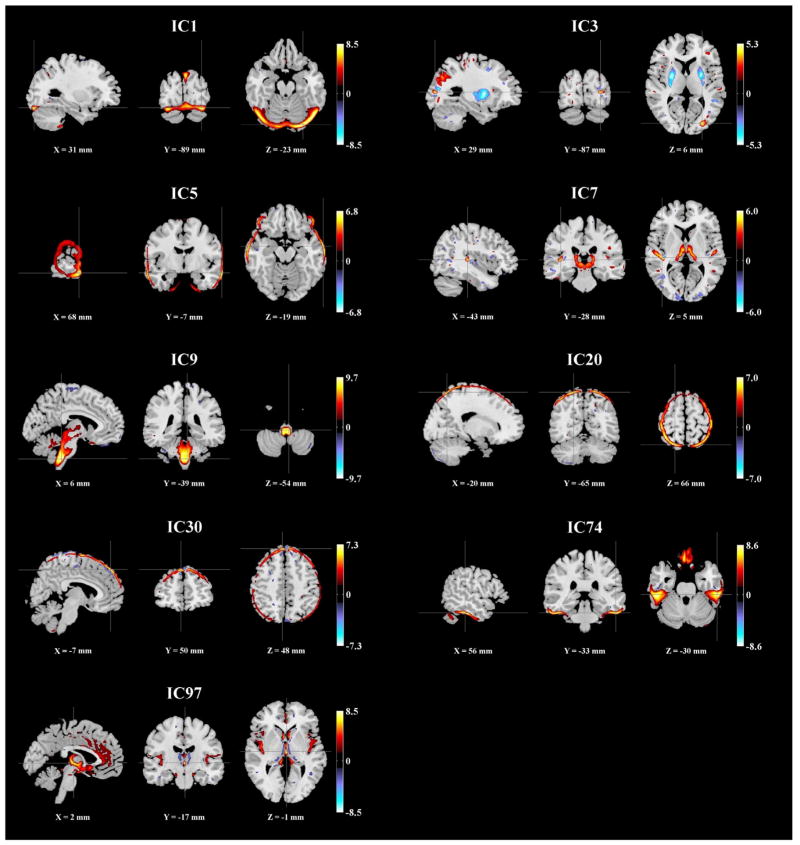
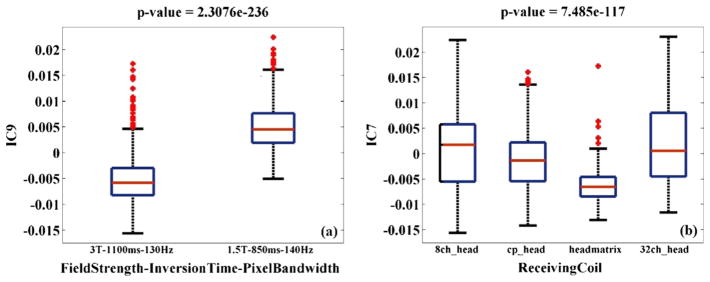
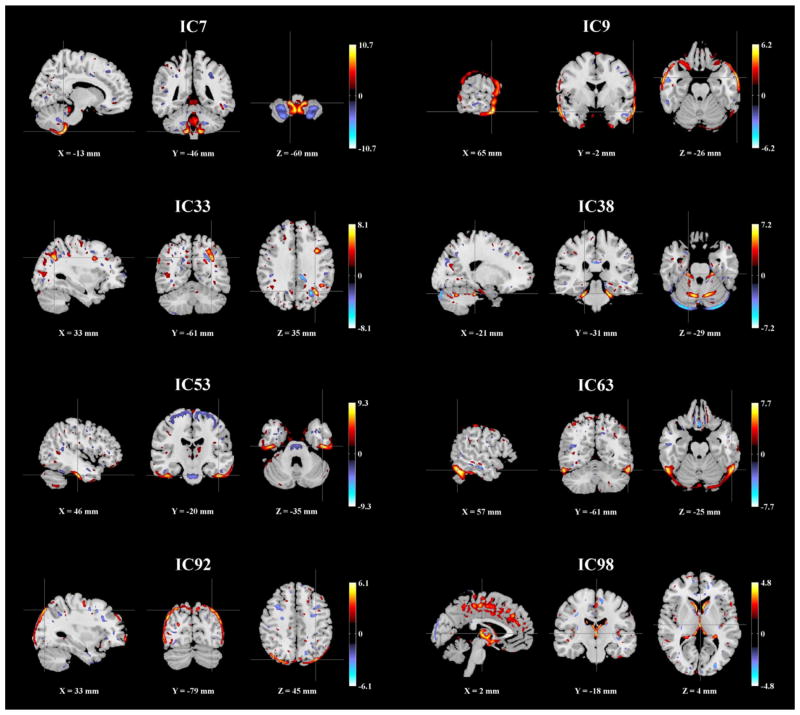
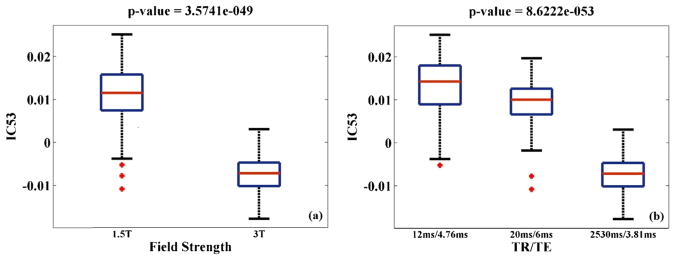
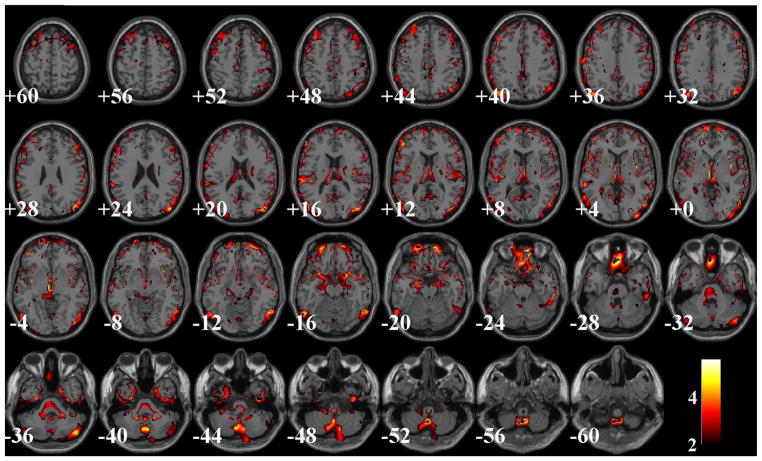
Results: A small set of SBM components captured most of the variance associated with the scanning differences. In a dataset of 1460 healthy subjects, pronounced and independent scanning effects were observed in brainstem and thalamus, associated with magnetic field strength-inversion time and RF-receiving coil. A second study with 110 schizophrenia patients and 124 healthy controls demonstrated that scanning effects can be effectively corrected with the SBM approach.
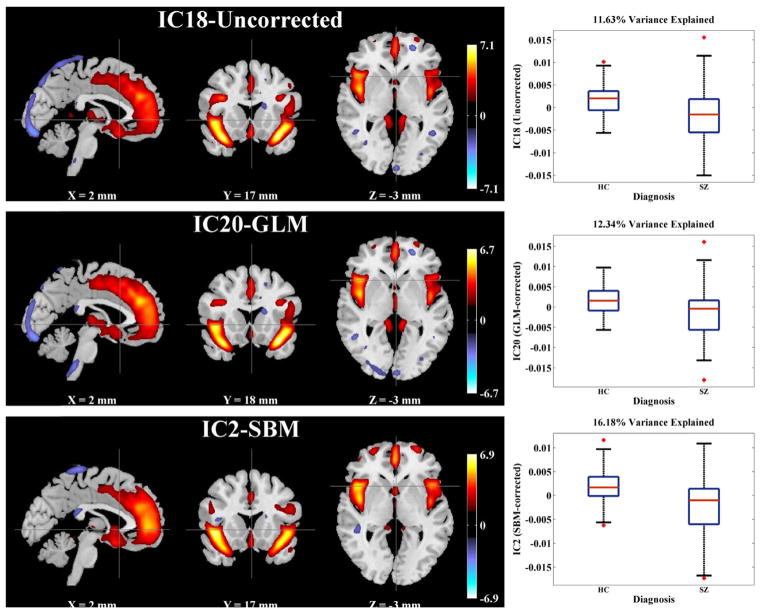
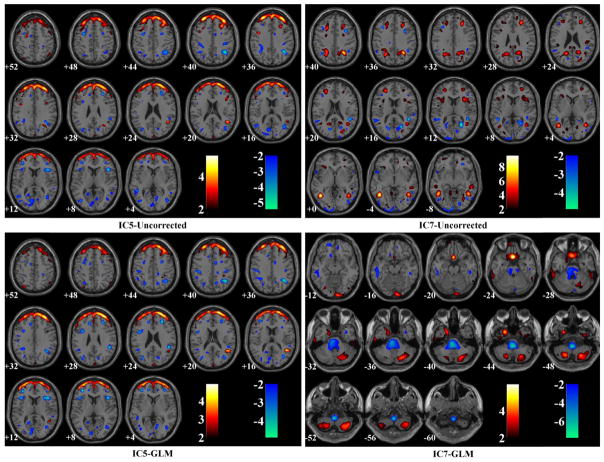
Comparison with existing method(s): Both SBM and GLM correction appeared to effectively eliminate the scanning effects. Meanwhile, the SBM-corrected data yielded a more significant patient versus control group difference and less questionable findings.
Conclusions: It is important to calibrate scanning settings and completely examine individual parameters for the control of confounding effects in multi-site sMRI studies. Both GLM and SBM correction can reduce scanning effects, though SBM's data-driven nature provides additional flexibility and is better able to handle collinear effects.
Keywords: ICA; Multi-site; Multivariate; SBM; sMRI.
Copyright © 2014 Elsevier B.V. All rights reserved.
Figures
References
-
- Amari S. Natural gradient works efficiently in learning. Neural Comput. 1998;10:251–76.
-
- Andreasen NC, Flaum M, Arndt S. The comprehensive assessment of symptoms and history (Cash) – an instrument for assessing diagnosis and psychopathology. Arch Gen Psychiatry. 1992;49:615–23. - PubMed
-
- Ashburner J, Friston KJ. Voxel-based morphometry—the methods. Neuroimage. 2000;11:805–21. - PubMed
-
- Ashburner J, Friston KJ. Unified segmentation. Neuroimage. 2005;26:839–51. - PubMed
-
- Bell AJ, Sejnowski TJ. An information-maximization approach to blind separation and blind deconvolution. Neural Comput. 1995;7:1129–59. - PubMed
Publication types
MeSH terms
Grants and funding
LinkOut - more resources
Full Text Sources
Other Literature Sources
Medical
Miscellaneous
