

Potentially preventable deaths from the five leading causes of death--United States, 2008-2010
- PMID: 24785982
- PMCID: PMC4584887
Potentially preventable deaths from the five leading causes of death--United States, 2008-2010
Abstract
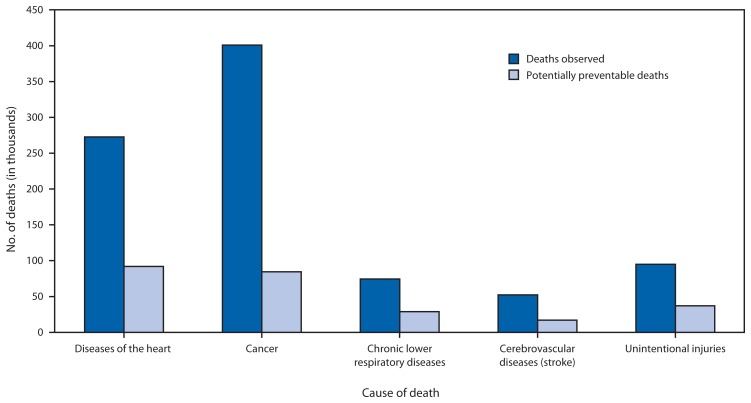
In 2010, the top five causes of death in the United States were 1) diseases of the heart, 2) cancer, 3) chronic lower respiratory diseases, 4) cerebrovascular diseases (stroke), and 5) unintentional injuries. The rates of death from each cause vary greatly across the 50 states and the District of Columbia (2). An understanding of state differences in death rates for the leading causes might help state health officials establish disease prevention goals, priorities, and strategies. States with lower death rates can be used as benchmarks for setting achievable goals and calculating the number of deaths that might be prevented in states with higher rates. To determine the number of premature annual deaths for the five leading causes of death that potentially could be prevented ("potentially preventable deaths"), CDC analyzed National Vital Statistics System mortality data from 2008-2010. The number of annual potentially preventable deaths per state before age 80 years was determined by comparing the number of expected deaths (based on average death rates for the three states with the lowest rates for each cause) with the number of observed deaths. The results of this analysis indicate that, when considered separately, 91,757 deaths from diseases of the heart, 84,443 from cancer, 28,831 from chronic lower respiratory diseases, 16,973 from cerebrovascular diseases (stroke), and 36,836 from unintentional injuries potentially could be prevented each year. In addition, states in the Southeast had the highest number of potentially preventable deaths for each of the five leading causes. The findings provide disease-specific targets that states can use to measure their progress in preventing the leading causes of deaths in their populations.
Figures
References
-
- Hoyert DL, Xu JQ. Deaths: preliminary data for 2011. Natl Vital Stat Rep. 2012;61(6) - PubMed
-
- Murphy SL, Xu JQ, Kochanek KD. Deaths: final data for 2010. Natl Vital Stat Rep. 2013;61(4) - PubMed
-
- National Heart Lung and Blood Institute. What are the risk factors for heart disease? Washington, DC: National Institutes of Health; 2012. Available at http://www.nhlbi.nih.gov/educational/hearttruth/lower-risk/risk-factors.htm.
-
- National Cancer Institute. Prevention, genetics, causes. Washington, DC: National Institutes of Health; 2013. Available at http://www.cancer.gov/cancertopics/prevention-genetics-causes.
-
- World Health Organization. Global surveillance, prevention and control of chronic respiratory diseases: a comprehensive approach. Geneva, Switzerland: World Health Organization; 2007. Risk factors for chronic respiratory diseases; pp. 37–55. Available at http://www.who.int/gard/publications/GARD%20Book%202007.pdf.
MeSH terms
LinkOut - more resources
Full Text Sources
Medical
