. 2014 May 1;10(5):e1004290.
doi: 10.1371/journal.pgen.1004290. eCollection 2014 May.

Copy number variation is a fundamental aspect of the placental genome

Affiliations

Copy number variation is a fundamental aspect of the placental genome

Roberta L Hannibal et al. PLoS Genet. .

Abstract

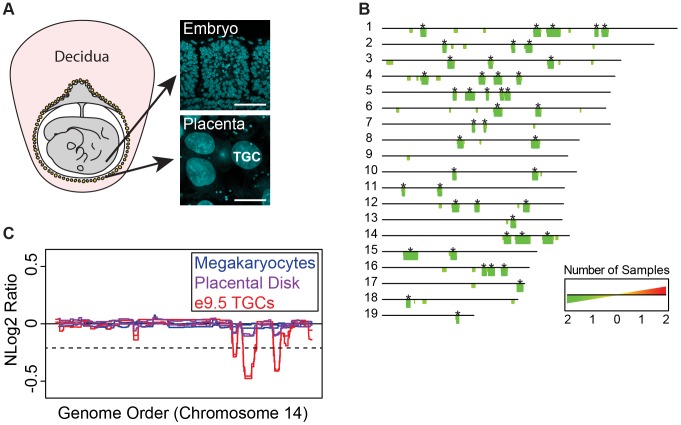
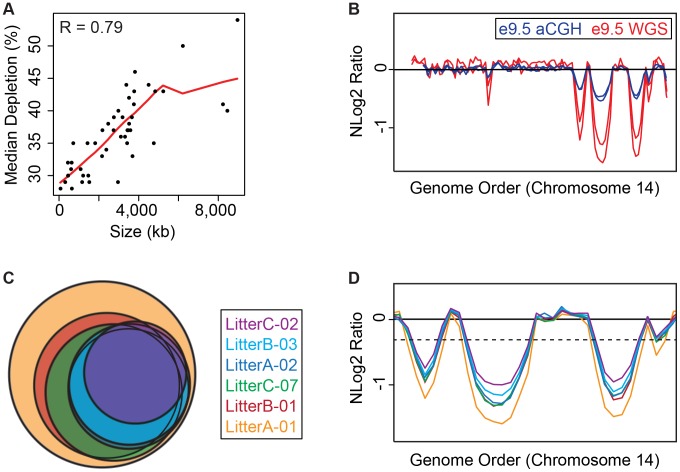
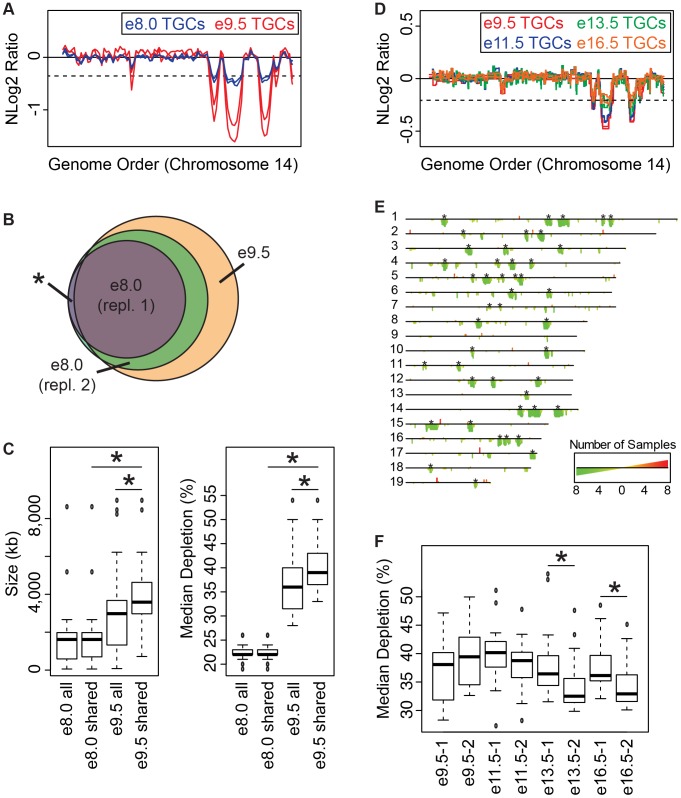
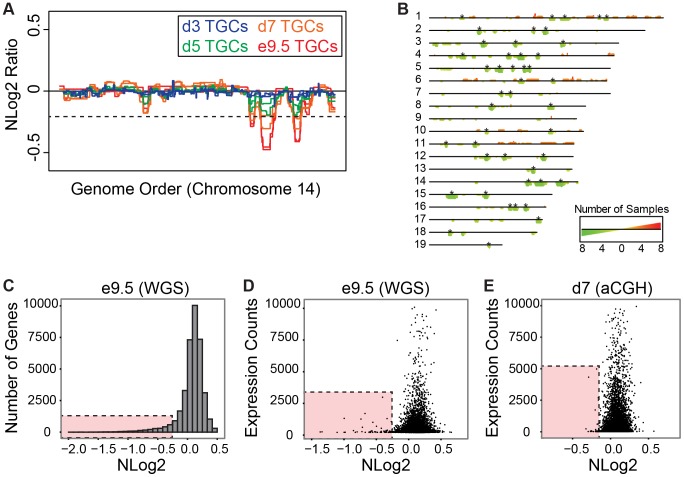
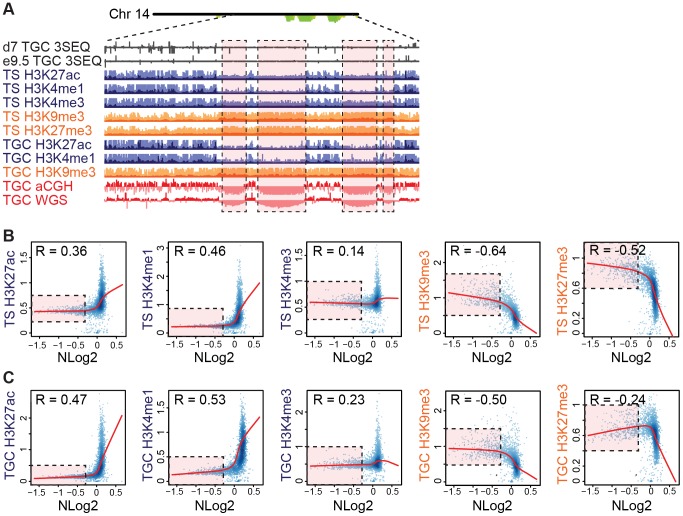
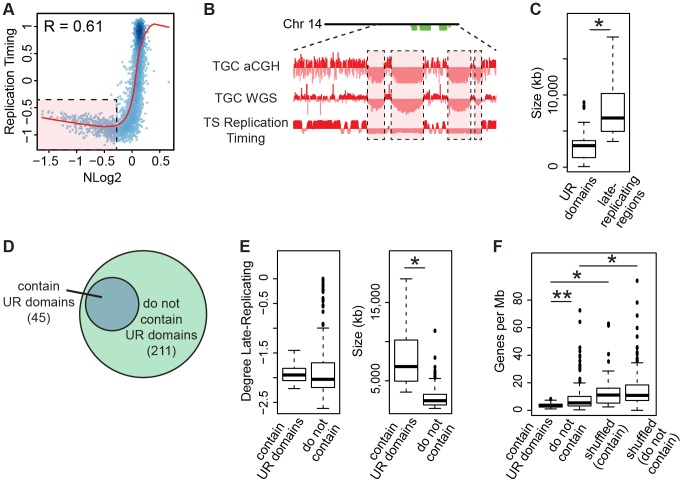
Discovery of lineage-specific somatic copy number variation (CNV) in mammals has led to debate over whether CNVs are mutations that propagate disease or whether they are a normal, and even essential, aspect of cell biology. We show that 1,000 N polyploid trophoblast giant cells (TGCs) of the mouse placenta contain 47 regions, totaling 138 Megabases, where genomic copies are underrepresented (UR). UR domains originate from a subset of late-replicating heterochromatic regions containing gene deserts and genes involved in cell adhesion and neurogenesis. While lineage-specific CNVs have been identified in mammalian cells, classically in the immune system where V(D)J recombination occurs, we demonstrate that CNVs form during gestation in the placenta by an underreplication mechanism, not by recombination nor deletion. Our results reveal that large scale CNVs are a normal feature of the mammalian placental genome, which are regulated systematically during embryogenesis and are propagated by a mechanism of underreplication.


Conflict of interest statement

The authors have declared that no competing interests exist.

Figures

Figure 1
Figure 1. UR domains are specific to TGCs.
A. TGCs in relationship to other embryonic and maternal tissues at embryonic day 9.5. Left: schematic of e9.5 conceptus. Yellow: parietal TGCs; gray: other embryonic/extraembryonic tissue; pink: maternal decidua. Right: confocal images of TGCs and embryonic cells (somites) stained for DAPI (blue) to show nuclear size. Scale bar = 75 µm. B. Location and reproducibility of UR domains on the autosomes of e9.5 TGCs. Summary of results from both biological replicates of e9.5 TGC vs. embryo aCGH (FDR = 0.0001). Darker green/longer bars (asterisks) indicate UR domains present in both replicates. C. UR domains are specific to TGCs. Plot comparing position along chromosome 14, a representative chromosome, to the normalized log 2 ratio (NLog2 Ratio) of array intensity of test vs. control. Red: e9.5 TGC vs. embryo; purple: placenta vs. embryo; blue: megakaryocyte vs. embryo. Two biological replicates are plotted for each cell type. Dashed line: FDR = 0.0001. All autosomes shown in Figure S2.
Figure 2
Figure 2. e9.5 UR domains characteristics.
A. UR domain size and depletion are correlated. Plot of size (0–8,500 kb) versus percent chromosomal median depletion (25–60%) of UR domains. B. UR domains are found using two different platforms: aCGH and WGS, although the calculated degree of underrepresentation is increased using WGS. Plot comparing position along chromosome 14 to the NLog2 Ratio of array intensity (aCGH) and sequence coverage (WGS) of TGCs vs. embryos. Red: e9.5 WGS; blue: e9.5 aCGH. Two biological replicates are plotted for each platform (LitterA shown for WGS). All autosomes shown in Figure S4. C. Individuals with a lesser number of UR domains have a subset of the UR domains found in the samples with a greater number of UR domains. Venn diagram showing UR domain overlap between six individuals from three separate litters (A, B and C). D. UR domains among individuals are nested. Plot comparing position along the last half of chromosome 14 to the NLog2 Ratio of sequence coverage of TGCs vs. embryos. Color code the same as in (B). Dashed line: cut-off for significance. All autosomes shown in Figure S5.
Figure 3
Figure 3. Degree of underrepresentation varies over developmental time.
A. UR domains exist at e8.0 and further develop over time. Plot comparing position along chromosome 14 to the NLog2 Ratio of sequence coverage of TGCs vs. embryos. Red: e9.5; blue: e8.0. Two biological replicates are plotted for each stage (LitterA shown for WGS). Dashed line: cut-off for significance. All autosomes shown in Figure S6. B. e8.0 TGCs have a subset of the UR domains found at e9.5. Venn diagram showing overlap of UR domains between both e8.0 replicates (one litter each) and UR domains common to all six e9.5 individuals. Asterisk represents the one UR domain present in both e8.0 replicates that is present in only 5/6 of the e9.5 individuals. C. Size and depletion of UR domains increases between e8.0 and e9.5. “e8.0 all”: UR domains present in both e8.0 replicates; “e8.0 shared”: UR domains present at e8.0 that are also present at e9.5; “e9.5 all”: all UR domains present in all six e9.5 individuals; “e9.5 shared”: UR domains present at e9.5 that are also present at e8.0. Box plot on left compares these classes of UR domains to size (0–8,500 kb), while box plot on right compares these classes to percent median depletion (15–60%). Asterisks mark comparisons that are statistically significant (p<0.01). D. UR domains present at late gestation. Plot comparing position along chromosome 14 to the NLog2 Ratio of array intensity of TGC vs. embryo. Red: e9.5; blue: e11.5; green: e13.5; orange: e16.5. Two biological replicates are plotted for each stage. Dashed line: FDR = 0.0001. All autosomes shown in Figure S7. E. Location of UR domains during the second half of gestation. Summary of results from both biological replicates of aCGH of TGCs from e9.5, e11.5, e13.5, and e16.5, all versus embryos (FDR = 0.0001). Darker green/longer bars indicate UR domains present in more replicates. Asterisks indicate the location of UR domains present at e9.5. F. Depletion of UR domains does not significantly change between e9.5 and e16.5, however, depletion of UR domains significantly differs between biological replicates at e13.5 and e16.5. Box plot compares percent median depletion of each biological replicate at stages e9.5, e11.5, e13.5, and e16.5. To compare with (C), aCGH data was normalized to WGS depletion levels (e9.5). Asterisks mark comparisons that are statistically significant (p<0.01).
Figure 4
Figure 4. UR domains have low gene content and expression both in vivo and in vitro.
A. In vitro TGCs produce the same UR domains as in vivo. Plot comparing position along chromosome 14 to the NLog2 Ratio of array intensity of TGC vs. embryo (e9.5) and TGC vs. TS cells (day 3, 5, and 7). Red: e9.5 (in vivo); blue: day 3 (in vitro); green: day 5 (in vitro); orange: day 7 (in vitro). Two biological replicates are plotted for each cell type. Dashed line: FDR = 0.0001. All autosomes shown in Figure S8. B. Location of UR domains on the autosomes of cultured TGCs compared to e9.5 in vivo TGCs. Summary of results from both biological replicates of aCGH of cultured TGCs differentiated 3, 5 and 7 days vs. TS cells, and of e9.5 in vivo TGCs vs. embryo (FDR = 0.0001). Darker green/longer bars indicate UR domains present in more replicates. Asterisks indicate the location of UR domains present in both replicates at e9.5. C. UR domains are gene poor. Histogram plotting number of Ensembl genes versus level of representation (NLog2 of TGCs vs. embryos (WGS)). UR domains boxed in pink. D. Low gene expression in UR domains in vivo. Plot of TGC normalized expression (NE) counts versus level of representation (NLog2 of e9.5 TGCs vs. embryos (WGS)). UR domains boxed in pink. E. Low gene expression in UR domains in vitro. Plot of TGC NE counts versus level of representation (NLog2 of day 7 TGCs vs. TS cells (aCGH)). Genes not present on the array were filtered out. UR domains boxed in pink.
Figure 5
Figure 5. UR domains are heterochromatic.
A. UR domains correlate with histone marks. Screen shot from the UCSC genome browser of the last half of chromosome 14 (schematic shown above screen shot) showing the following: 3SEQ from in vivo e9.5 TGCs and in vitro d7 TGCs (black), active histone marks (H3K27ac, H3K4me1, H3K4me3; dark purple) and repressive histone marks (H3K9me3, H3K27me3; orange) for cultured TS cells and TGCs, and aCGH and WGS data from in vivo e9.5 TGCs (pink/red). Histone mark mean is darker color, maximum is lighter color. UR domains boxed in pink. B. UR domains are a subset of heterochromatin in TS cells. The Pearson correlation (R) between NLog2 values of TGC vs. embryo (WGS) and fold enrichment (FE) for histone marks. Data points represent 1 Mb windows in the genome. UR domains (negative NLog2 values) are correlated with high values for repressive histone marks (negative R values). UR domains (negative NLog2 values) are negatively correlated with high values for active histone marks (positive R values). Red lines represent the lowess line (locally weighted scatterplot smoothing) of the data points. UR domains boxed in pink. C. UR domains are a subset of heterochromatin in TGCs. See (B) for plot details.
Figure 6
Figure 6. TGC UR domains are a subset of late-replicating regions in TS cells.
A. UR domains correlate with late-replicating regions in TS cells. The Pearson correlation (R) between NLog2 values of TGC vs. embryo (WGS) and average TS replication timing. Data points represent 1 Mb windows in the genome. UR domains boxed in pink. B. UR domains are late-replicating. Screen shot from the UCSC genome browser of the second half of chromosome 14 (schematic shown above screen shot) depicting the following: aCGH and WGS data from e9.5 TGCs and replication timing data from cultured TS cells. UR domains boxed in pink. C. Box plot analysis shows that UR domains are smaller than the late-replicating regions that contain them. Asterisk marks the comparison that is statistically significant (p<0.01). D. UR domains form from a subset of late-replicating regions. Diagram depicting late-replicating regions that contain UR domains versus ones that do not contain UR domains. E. Box plot analysis shows that the late-replicating regions that contain UR domains are significantly larger, but not significantly more late-replicating, than those that do not. Asterisk marks the comparison that is statistically significant (p<0.01). F. Box plot analysis shows that the late-replicating regions that contain UR domains have significantly fewer genes than those that do not (double asterisks). “Shuffled” refers to a random set of regions that have the same length and chromosome distribution. Asterisks mark comparisons that are statistically significant (p<0.01).

References

    1. Lupski JR (2013) One Human, Multiple Genomes—Genome Mosaicism. Science 341: 358–359 10.1126/science.1239503 - DOI - PubMed
    1. Poduri A, Evrony GD, Cai X, Walsh CA (2013) Somatic mutation, genomic variation, and neurological disease. Science 341: 1237758 10.1126/science.1237758 - DOI - PMC - PubMed
    1. Jackson KJL, Kidd MJ, Wang Y, Collins AM (2013) The shape of the lymphocyte receptor repertoire: lessons from the B cell receptor. Front Immunol 4: 263 10.3389/fimmu.2013.00263 - DOI - PMC - PubMed
    1. Abyzov A, Mariani J, Palejev D, Zhang Y, Haney MS, et al. (2012) Somatic copy number mosaicism in human skin revealed by induced pluripotent stem cells. Nature 492: 438–442 10.1038/nature11629 - DOI - PMC - PubMed
    1. O'Huallachain M, Karczewski KJ, Weissman SM, Urban AE, Snyder MP (2012) Extensive genetic variation in somatic human tissues. Proc Natl Acad Sci U S A 109: 18018–18023 10.1073/pnas.1213736109 - DOI - PMC - PubMed

Publication types