

Statistical modeling reveals the effect of absolute humidity on dengue in Singapore
- PMID: 24786517
- PMCID: PMC4006725
- DOI: 10.1371/journal.pntd.0002805
Statistical modeling reveals the effect of absolute humidity on dengue in Singapore
Abstract
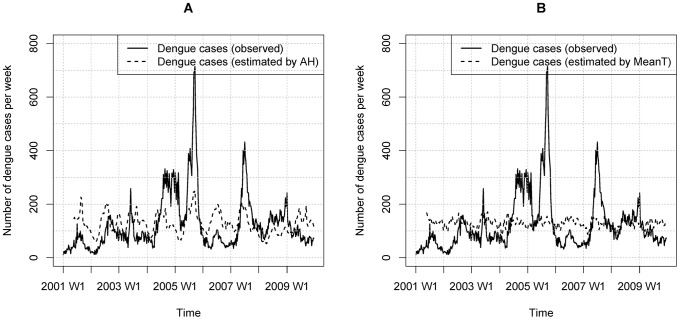
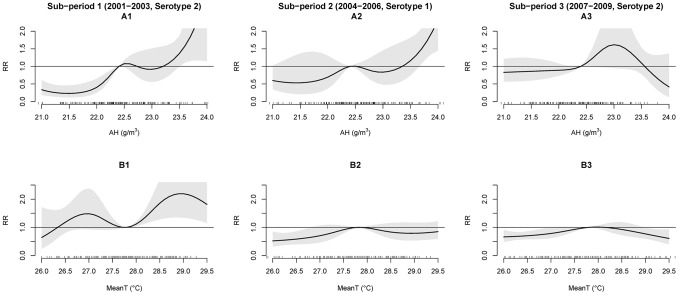
Weather factors are widely studied for their effects on indicating dengue incidence trends. However, these studies have been limited due to the complex epidemiology of dengue, which involves dynamic interplay of multiple factors such as herd immunity within a population, distinct serotypes of the virus, environmental factors and intervention programs. In this study, we investigate the impact of weather factors on dengue in Singapore, considering the disease epidemiology and profile of virus serotypes. A Poisson regression combined with Distributed Lag Non-linear Model (DLNM) was used to evaluate and compare the impact of weekly Absolute Humidity (AH) and other weather factors (mean temperature, minimum temperature, maximum temperature, rainfall, relative humidity and wind speed) on dengue incidence from 2001 to 2009. The same analysis was also performed on three sub-periods, defined by predominant circulating serotypes. The performance of DLNM regression models were then evaluated through the Akaike's Information Criterion. From the correlation and DLNM regression modeling analyses of the studied period, AH was found to be a better predictor for modeling dengue incidence than the other unique weather variables. Whilst mean temperature (MeanT) also showed significant correlation with dengue incidence, the relationship between AH or MeanT and dengue incidence, however, varied in the three sub-periods. Our results showed that AH had a more stable impact on dengue incidence than temperature when virological factors were taken into consideration. AH appeared to be the most consistent factor in modeling dengue incidence in Singapore. Considering the changes in dominant serotypes, the improvements in vector control programs and the inconsistent weather patterns observed in the sub-periods, the impact of weather on dengue is modulated by these other factors. Future studies on the impact of climate change on dengue need to take all the other contributing factors into consideration in order to make meaningful public policy recommendations.
Conflict of interest statement
The authors have declared that no competing interests exist.
Figures
References
-
- Hales S, de Wet N, Maindonald J, Woodward A (2002) Potential effect of population and climate changes on global distribution of dengue fever: an empirical model. Lancet 360: 830–834. - PubMed
-
- Gubler DJ (2008) Dengue/Dengue Haemorrhagic Fever: History and Current Status. In G. Bock, & J. Goode, Treatment Strategies for Dengue and Other Flaviviral Diseases: Novartis Foundation Symposium 277. Chichester, UK: John Wiley & Sons.
-
- Trent DW, Grant JA, Monath TP, Manske CL, Corina M, et al. (1989) Genetic variation and microevolution of dengue 2 virus in Southeast Asia. Virology 172: 523–535. - PubMed
Publication types
MeSH terms
LinkOut - more resources
Full Text Sources
Other Literature Sources
Medical
