

Left ventricular ejection fraction and volumes: it depends on the imaging method
- PMID: 24786629
- PMCID: PMC4231568
- DOI: 10.1111/echo.12331
Left ventricular ejection fraction and volumes: it depends on the imaging method
Abstract
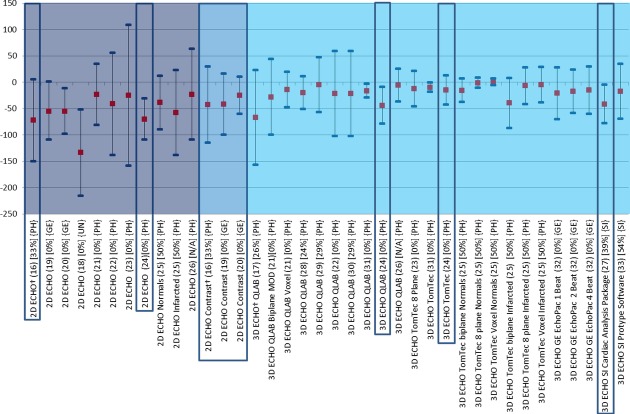
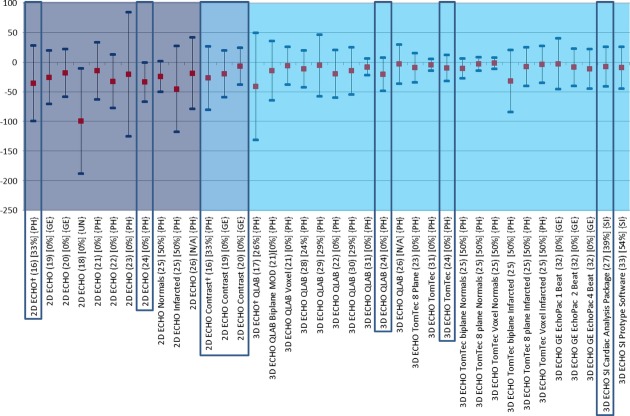
Background and methods: In order to provide guidance for using measurements of left ventricular (LV) volume and ejection fraction (LVEF) from different echocardiographic methods a PubMed review was performed on studies that reported reference values in normal populations for two-dimensional (2D ECHO) and three-dimensional (3D ECHO) echocardiography, nuclear imaging, cardiac computed tomography, and cardiac magnetic resonance imaging (CMR). In addition all studies (2 multicenter, 16 single center) were reviewed, which included at least 30 patients, and the results compared of noncontrast and contrast 2D ECHO, and 3D ECHO with those of CMR.
Results: The lower limits for normal LVEF and the normal ranges for end-diastolic (EDV) and end-systolic (ESV) volumes were different in each method. Only minor differences in LVEF were found in studies comparing CMR and 2D contrast echocardiography or noncontrast 3D echocardiography. However, EDV and ESV measured with all echocardiographic methods were smaller and showed greater variability than those derived from CMR. Regarding agreement with CMR and reproducibility, all studies showed superiority of contrast 2D ECHO over noncontrast 2D ECHO and 3D ECHO over 2D ECHO. No final judgment can be made about the comparison between contrast 2D ECHO and noncontrast or contrast 3D ECHO.
Conclusion: Contrast 2D ECHO and noncontrast 3D ECHO show good reproducibility and good agreement with CMR measurements of LVEF. The agreement of volumes is worse. Further studies are required to assess the clinical value of contrast 3D ECHO as noncontrast 3D ECHO is only reliable in patients with good acoustic windows.
Keywords: contrast imaging; echocardiography; left ventricular ejection fraction; left ventricular function; three‐dimensional transthoracic echocardiography.
© 2013 The Authors. Echocardiography published by Wiley Periodicals, Inc.
Figures

References
-
- Zamorano JL, Bax JJ, Rademakers FE. Evaluation of Systolic and Diastolic LV Function. The ESC Textbook of Cardiovascular Imaging. New York: Springer; 2010. pp. 307–320.
-
- Myles PS, Cui JI. Using the Bland–Altman method to measure agreement with repeated measures. Br J Anaesth. 2007;99:309–311. - PubMed
-
- Alfakih K, Plein S, Thiele H. Normal human left and right ventricular dimensions for MRI as assessed by turbo gradient echo and steady-state free precession imaging sequences. J Magn Reson Imaging. 2003;17:323–329. - PubMed
Publication types
MeSH terms
LinkOut - more resources
Full Text Sources
Other Literature Sources
