. 2014 Apr 30;9(4):e93319.
doi: 10.1371/journal.pone.0093319. eCollection 2014.

Stability of bivariate GWAS biomarker detection

Affiliations

Stability of bivariate GWAS biomarker detection

Justin Bedő et al. PLoS One. .

Abstract

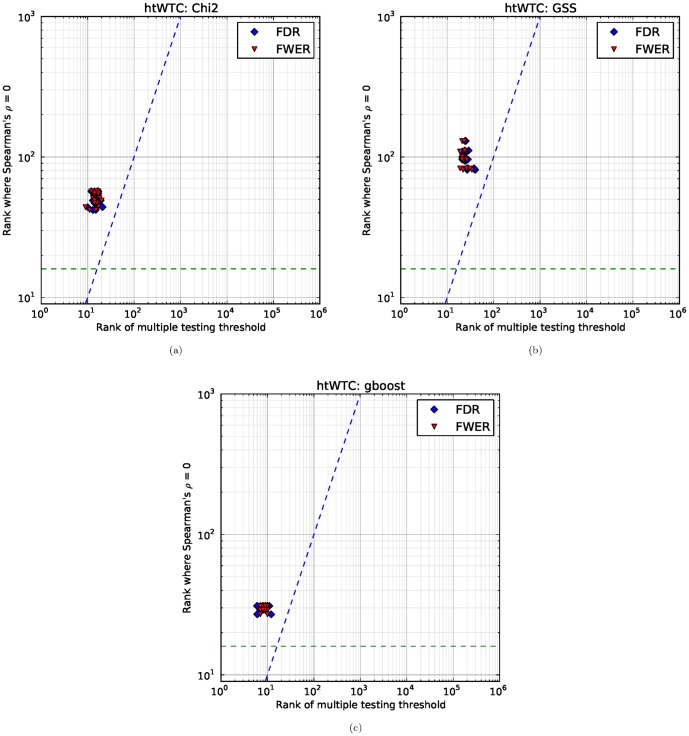
Given the difficulty and effort required to confirm candidate causal SNPs detected in genome-wide association studies (GWAS), there is no practical way to definitively filter false positives. Recent advances in algorithmics and statistics have enabled repeated exhaustive search for bivariate features in a practical amount of time using standard computational resources, allowing us to use cross-validation to evaluate the stability. We performed 10 trials of 2-fold cross-validation of exhaustive bivariate analysis on seven Wellcome-Trust Case-Control Consortium GWAS datasets, comparing the traditional [Formula: see text] test for association, the high-performance GBOOST method and the recently proposed GSS statistic (Available at http://bioinformatics.research.nicta.com.au/software/gwis/). We use Spearman's correlation to measure the similarity between the folds of cross validation. To compare incomplete lists of ranks we propose an extension to Spearman's correlation. The extension allows us to consider a natural threshold for feature selection where the correlation is zero. This is the first reported cross-validation study of exhaustive bivariate GWAS feature selection. We found that stability between ranked lists from different cross-validation folds was higher for GSS in the majority of diseases. A thorough analysis of the correlation between SNP-frequency and univariate [Formula: see text] score demonstrated that the [Formula: see text] test for association is highly confounded by main effects: SNPs with high univariate significance replicably dominate the ranked results. We show that removal of the univariately significant SNPs improves [Formula: see text] replicability but risks filtering pairs involving SNPs with univariate effects. We empirically confirm that the stability of GSS and GBOOST were not affected by removal of univariately significant SNPs. These results suggest that the GSS and GBOOST tests are successfully targeting bivariate association with phenotype and that GSS is able to reliably detect a larger set of SNP-pairs than GBOOST in the majority of the data we analysed. However, the [Formula: see text] test for association was confounded by main effects.


Conflict of interest statement

Competing Interests: The authors have declared that no competing interests exist.

Figures

Figure 1
Figure 1. Spearman's ρ for all three methods (χ2, GSS, and GBOOST) on BD dataset.
On this dataset, GSS fails to obtain a stable set of pairs on average. GBOOST and χ2 both have similar profiles and show similar ZIC points. Note that while the peaks for GBOOST and χ2 occur at approximately the same number of pairs, the higher ρ for GBOOST indicates better stability of the ordering within the stable set.
Figure 2
Figure 2. Spearman's ρ plot – similar to fig. 1 – for CAD dataset.
Here, GSS is selecting a much larger stable set of features than χ2 and GBOOST, indicated by the ZIC ocurring at much larger number of pairs. Like BD, GBOOST and χ2 have similar profiles with GBOOST exhibiting better stability in the ordering than χ2.
Figure 3
Figure 3. Spearman's ρ plot – similar to fig. 1 – for RA dataset.
Here, GSS selects a significantly larger number of pairs in it's stable set while GBOOST selects relatively few. χ2 selects a small stable set, like GBOOST, but has curious tail behaviour where the stability increases again with a very large number of pairs. Furthermore, though GBOOST has better stability in the ordering than χ2, it is not significantly better than GSS unlike fig. 2.
Figure 4
Figure 4. Jaccard distance for all three methods (χ2, GSS, and GBOOST) on BD dataset.
Figure 5
Figure 5. Jaccard plot for CAD dataset.
Figure 6
Figure 6. Jaccard plot for RA dataset.
Figure 7
Figure 7. Boxplot of the number of pairs involving a univariately significant SNP (by univariate χ2 test) for each dataset and method.
The extreme high counts for CD, RA, and T1D datasets for the χ2 test indicate that these datasets are strongly confounded by extremely large hubs driven by main effects. These datasets also demonstrate the U-shaped tail behaviour of χ2 (e.g., fig. 3), indicating the high stability is only caused by these very large stable hubs. GSS is not shown on the BD or HT datasets as there were no pairs associated with a univariately signifiant SNP.
Figure 8
Figure 8. Spearman's ρ plot for pruned RA dataset – similar to fig. 1.
After dataset pruning (by removing SNPs significant under a univariate χ2 test) we see the curious tail behaviour of χ2 is gone. The GSS profile remains similar to fig. 3. This suggests the tail effect is caused by main effects confounding the χ2 interaction test.
Figure 9
Figure 9. Jaccard plot for pruned RA dataset.
Figure 10
Figure 10. The overlap between SNP pairs found by GSS and GBOOST is plotted for various values of k.
The vertical axis is scaled by the size of the union of both sets. The blue, green and red sections show respectively: the percentage of pairs which are found by GSS only, common to both methods, and found by GBOOST only. The vertical dashed red and blue lines are the ZIC values for GSS and GBOOST respectively. In all 7 datasets the relative size of the intersection set for both methods peaks at a k lower than max(kZIC GBOOST, kZIC GSS). Since both methods are intended to capture a similar type of interaction and do not have a substantial intersection at higher k, this supports the idea that ZIC is a useful heuristic. Over all values of k for all datasets, the max intersection set size ranges from 0.2 to 0.4. Despite some agreement, the fact that both methods are able to reliably select independent sets of pairs suggests that there are fundamental differences between the pairs selected by both methods. These intersection plots are shown for all datasets in the supplement. The result for the CD dataset is shown here as an example.
Figure 11
Figure 11. Comparing multiple testing correction and stability.
On the horizontal axis, we have the rank at which the pair falls below the multiple testing correction threshold. On the vertical axis, we have the rank at which ZIC occurs. The dashed blue line is the diagonal, representing equal ranks for both ZIC and FWER/FDR. The green dashed line represents the floor for ZIC (we do not search for ZIC lower than this point due to noise). The scatter plot shows points which are above the diagonal, which means that the number of SNP pairs which are stable is consistently higher than both FWER and FDR correction.
Figure 12
Figure 12. Comparing multiple testing correction and stability.
Plot axes are the same as in fig. 11. The χ2 hypothesis test exhibits wildly differing values for FDR in different splits of the dataset, which means that the number of significant SNP pairs cannot be stably determined for this dataset. Note that we only retain the top 500,000 SNP pairs in our calculations hence the points on the right actually mean that more than 500,000 pairs pass multiple testing correction (which is highly implausible for these datasets). Observe that ZIC has only a small variance between different splits of the data. Furthermore, observe that the GSS statistic does not exhibit the large variance in multiple testing correction values. a: χ2; b: GSS; c: GBOOST.

Similar articles

Cited by

References

    1. Lewis CM, Knight J (2012) Introduction to genetic association studies. Cold Spring Harbor protocols 2012: 297–306 10.1101/pdb.top068163 - DOI - PubMed
    1. Visscher PM, Brown Ma, McCarthy MI, Yang J (2012) Five years of GWAS discovery. American journal of human genetics 90: 7–24 10.1016/j.ajhg.2011.11.029 - DOI - PMC - PubMed
    1. Manolio Ta, Collins FS, Cox NJ, Goldstein DB, Hindorff La, et al. (2009) Finding the missing heritability of complex diseases. Nature 461: 747–53 10.1038/nature08494 - DOI - PMC - PubMed
    1. Zuk O, Hechter E, Sunyaev SR, Lander ES (2012) The mystery of missing heritability: Genetic interactions create phantom heritability. Proc Natl Acad Sci USA 109: 1193–1198 10.1073/pnas.1119675109 - DOI - PMC - PubMed
    1. Goudey B, Rawlinson D, Wang Q, Shi F, Ferra H, et al. (2013) GWIS - model-free, fast and exhaustive search for epistatic interactions in case-control GWAS. BMC genomics 14 Suppl 3: S10 10.1186/1471-2164-14-S3-S10 - DOI - PMC - PubMed

Publication types

LinkOut - more resources