. 2014 May 1;5(5):e1204.
doi: 10.1038/cddis.2014.164.

Quantitative multi-parametric evaluation of centrosome declustering drugs: centrosome amplification, mitotic phenotype, cell cycle and death

Affiliations

Quantitative multi-parametric evaluation of centrosome declustering drugs: centrosome amplification, mitotic phenotype, cell cycle and death

A Ogden et al. Cell Death Dis. .

Abstract

Unlike normal cells, cancer cells contain amplified centrosomes and rely on centrosome clustering mechanisms to form a pseudobipolar spindle that circumvents potentially fatal spindle multipolarity (MP). Centrosome clustering also promotes low-grade chromosome missegregation, which can drive malignant transformation and tumor progression. Putative 'centrosome declustering drugs' represent a cancer cell-specific class of chemotherapeutics that produces a common phenotype of centrosome declustering and spindle MP. However, differences between individual agents in terms of efficacy and phenotypic nuances remain unexplored. Herein, we have developed a conceptual framework for the quantitative evaluation of centrosome declustering drugs by investigating their impact on centrosomes, clustering, spindle polarity, cell cycle arrest, and death in various cancer cell lines at multiple drug concentrations over time. Surprisingly, all centrosome declustering drugs evaluated in our study were also centrosome-amplifying drugs to varying extents. Notably, all declustering drugs induced spindle MP, and the peak extent of MP positively correlated with the induction of hypodiploid DNA-containing cells. Our data suggest acentriolar spindle pole amplification as a hitherto undescribed activity of some declustering drugs, resulting in spindle MP in cells that may not have amplified centrosomes. In general, declustering drugs were more toxic to cancer cell lines than non-transformed ones, with some exceptions. Through a comprehensive description and quantitative analysis of numerous phenotypes induced by declustering drugs, we propose a novel framework for the assessment of putative centrosome declustering drugs and describe cellular characteristics that may enhance susceptibility to them.


Figures
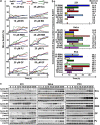
Figure 1
Figure 1
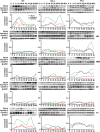
Mitotic arrest (MA) phenotypes observed upon treatment with putative centrosome declustering drugs. (a) SubG1 and mitotically arrested cell population fractions with respect to time post-treatment with various putative declustering drugs. Declustering drugs included Nos, BN, RBN, PJ, and GF, all at 10 and 25 μM except GF, which was used at 25 and 50 μM, and cell lines included 231, PC3, and HeLa. These cell lines demonstrated differential susceptibility to various agents depending on drug concentration over the 48 h time period. In general, MA increased from 0 h to a peak near 24 h, followed by a decline in MA that coincided with increases in subG1 fractions. Results are representative of three independent experiments. (b) Duration of MA and peak MA by maximum subG1 fraction. Drugs are ranked in order of increasing peak subG1 from bottom to top along the y axis. The duration of MA (defined as the duration for which the mitotic population in drug-treated cells was greater than two times that in control cells) is plotted along the x axis. The time at which peak MA occurred is illustrated as a red bar and the value of peak MA is listed to the right of the graph. In 231 cells, 10 BN did not cause any MA; therefore, no bar is plotted. For 10 Nos in 231 cells and 25 PJ in PC3 cells, MA was observed at only one time point and is depicted using a single red bar. Some drugs produced a MA that then subsided and ultimately recurred, resulting in two bars being plotted, namely 50 GF in HeLa and PC3 cells. (c) Western blotting of cell cycle-related proteins and caspase-3, a marker for apoptosis. To assess cell cycle progression following treatment with different declustering drugs (all at 25 μM), cell lysates were obtained at multiple time points over 48 h and immunoblotted for Cyclins E and B1. Increased levels of both cyclins compared with controls (0 h) were detected across cell lines with variable expression patterns depending on the drug and cell line. To evaluate apoptosis, cleaved caspase-3 (C. Caspase-3) was immunoblotted and eventual increases over controls were universally detected, typically by 24 h
Figure 2
Figure 2
Centrosome declustering drug-induced changes in expression levels of markers of centrosome amplification. To evaluate the levels of some of the well-established markers of CA upon treatment with declustering drugs at a concentration of 25 μM, the levels of PLK4, Cyclin E, and Aurora A were assessed by western blotting, revealing eventual increases over untreated controls across cell lines. Increase in expression levels of PLK4 and Aurora A was generally rapid, often appearing by 4 h. Levels tended to vary thereafter depending on the drug and cell line. Densitometry was performed to quantitate the changes in levels of CA markers relative to β-actin over time, and the changes in actin-normalized expression levels over the time-course of the experiment are depicted graphically beneath each sets of blots. As the Cyclin E blots revealed two closely placed bands (49 and 43 kDa) corresponding to the two spliced forms, the Cyclin E band intensity was generated as a sum of the two band intensities
Figure 3
Figure 3
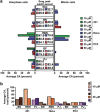
Average CA observed over 24 h and its relationship with peak subG1 for each drug treatment regimen. (a) Displayed are only statistically significant (P<0.05) increases in average CA over controls. To calculate average CA, the sum of percentage of (interphase or mitotic) cells showing CA at the 6, 12, 18, and 24 h time points was divided by 4. (b) Depiction of the sum of average CA (interphase plus mitotic) observed when 231 cells were treated with RBN, BN, and PJ, compared with the treatment of HeLa and PC3 cells with the same three drugs
Figure 4
Figure 4
Representative confocal micrographs depicting centrosome amplification in controls and drug-treated cancer cells. (a) Interphase and (b) mitotic cells. Only displayed are drug/cell line combinations in which statistically significant (P<0.05) fold increases in CA were found in mitotic cells, although all controls are shown regardless of the extent of endogenous CA. Blue=DNA, green=microtubules, red=γ-tubulin, and orange=centrin-2
Figure 5
Figure 5
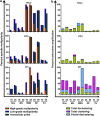
(a) Peak MP and peak acentriolar pole formation induced by different declustering drugs in 231, HeLa, and PC3 cells. The maximum extents of MP induction of high grades (5+ poles) and low grades (3–4 poles) and acentriolar pole formation (at least one pole without centrioles) across a 24-h period are given for all drugs. (b) Peak CA and declustering of amplified centrosomes induced in 231, HeLa, and PC3 cells. The maximum extent of CA in mitosis over 24 h is depicted by the height of the bar. The extent of total clustering (all centrosomes clustered at two poles), total declustering (all centrosomes separated to different poles), and partial declustering (one or more poles with 2+ centrosomes) are given for that same time point
Figure 6
Figure 6
Correlates of peak subG1 percent within cell lines. (a) 231 cells, beta regression. (ai) In 231 cells, a clear trend was found for increasing peak MP of any grade and peak subG1, which was highly statistically significant (P=0.006; pseudoR2=0.833). (aii) Furthermore, multiple regression using peak MP (high grade) and peak MP (low grade) produced an even better, statistically significant fit (red line) compared with simulated values (P=0.001; pseudoR2=0.860). Within this model, both variables were very highly statistically significant (P<0.0001), with peak high-grade MP showing a positive correlation and peak low-grade MP showing a negative correlation with peak subG1 (based on the sign of the beta coefficients). (b) PC3 cells, linear regression. In these cells, the average fold increase in interphase CA shows some association with peak subG1, which almost reached statistical significance and which produced a good fit (P=0.057; R2=0.619). (c) HeLa cells, beta regression. (ci) Increasing peak MP of any grade was associated with peak subG1 (P=0.0055; pseudoR2=0.575), as was (cii). Increasing peak MP of high grade (P=0.028; pseudoR2=0.271). (ciii) Increasing peak acentriolar pole formation (P=0.0023; pseudoR2=0.600), and (civ) peak total declustering (P=0.020; pseudoR2=0.424)
Figure 7
Figure 7
Diversity of phenotypes produced by putative centrosome declustering drugs. One of the two central cells with bipolar spindles show normal centrosome number (left cell) and the other one shows amplified centrosomes (right cell). Both types of cells are susceptible to the declustering agents. For the cell without CA, acentriolar pole formation (i.e., pole amplification or pole declustering) and MP (low- or high-grade) may be induced. Alternatively, these agents may induce CA and permit bona fide centrosome declustering to occur, partially or in total, with or without acentriolar pole formation. For the cell with CA, genuine centrosome declustering may occur, partially or in total, with or without acentriolar pole formation, and with or without further CA. AC, acentriolar; DC, declustering; HGCA, high-grade CA; HGMP, high-grade MP; LGCA, low-grade CA; LGMP, low-grade MP

References

    1. Chan JY. A clinical overview of centrosome amplification in human cancers. Int J Biol Sci. 2011;7:1122–1144. - PMC - PubMed
    1. Basto R, Brunk K, Vinadogrova T, Peel N, Franz A, Khodjakov A, et al. Centrosome amplification can initiate tumorigenesis in flies. Cell. 2008;133:1032–1042. - PMC - PubMed
    1. Ogden A, Rida PC, Aneja R. Heading off with the herd: how cancer cells might maneuver supernumerary centrosomes for directional migration. Cancer Metastasis Rev. 2012;32:269–287. - PMC - PubMed
    1. Vitale I, Galluzzi L, Castedo M, Kroemer G. Mitotic catastrophe: a mechanism for avoiding genomic instability. Nat Rev Mol Cell Biol. 2011;12:385–392. - PubMed
    1. Holland AJ, Cleveland DW. Boveri revisited: chromosomal instability, aneuploidy and tumorigenesis. Nat Rev Mol Cell Biol. 2009;10:478–487. - PMC - PubMed

Substances

LinkOut - more resources