. 2014 Sep;142(9):1978-89.
doi: 10.1017/S0950268814000946. Epub 2014 May 1.

Validation of three geolocation strategies for health-facility attendees for research and public health surveillance in a rural setting in western Kenya

Affiliations

Validation of three geolocation strategies for health-facility attendees for research and public health surveillance in a rural setting in western Kenya

G H Stresman et al. Epidemiol Infect. 2014 Sep.

Abstract

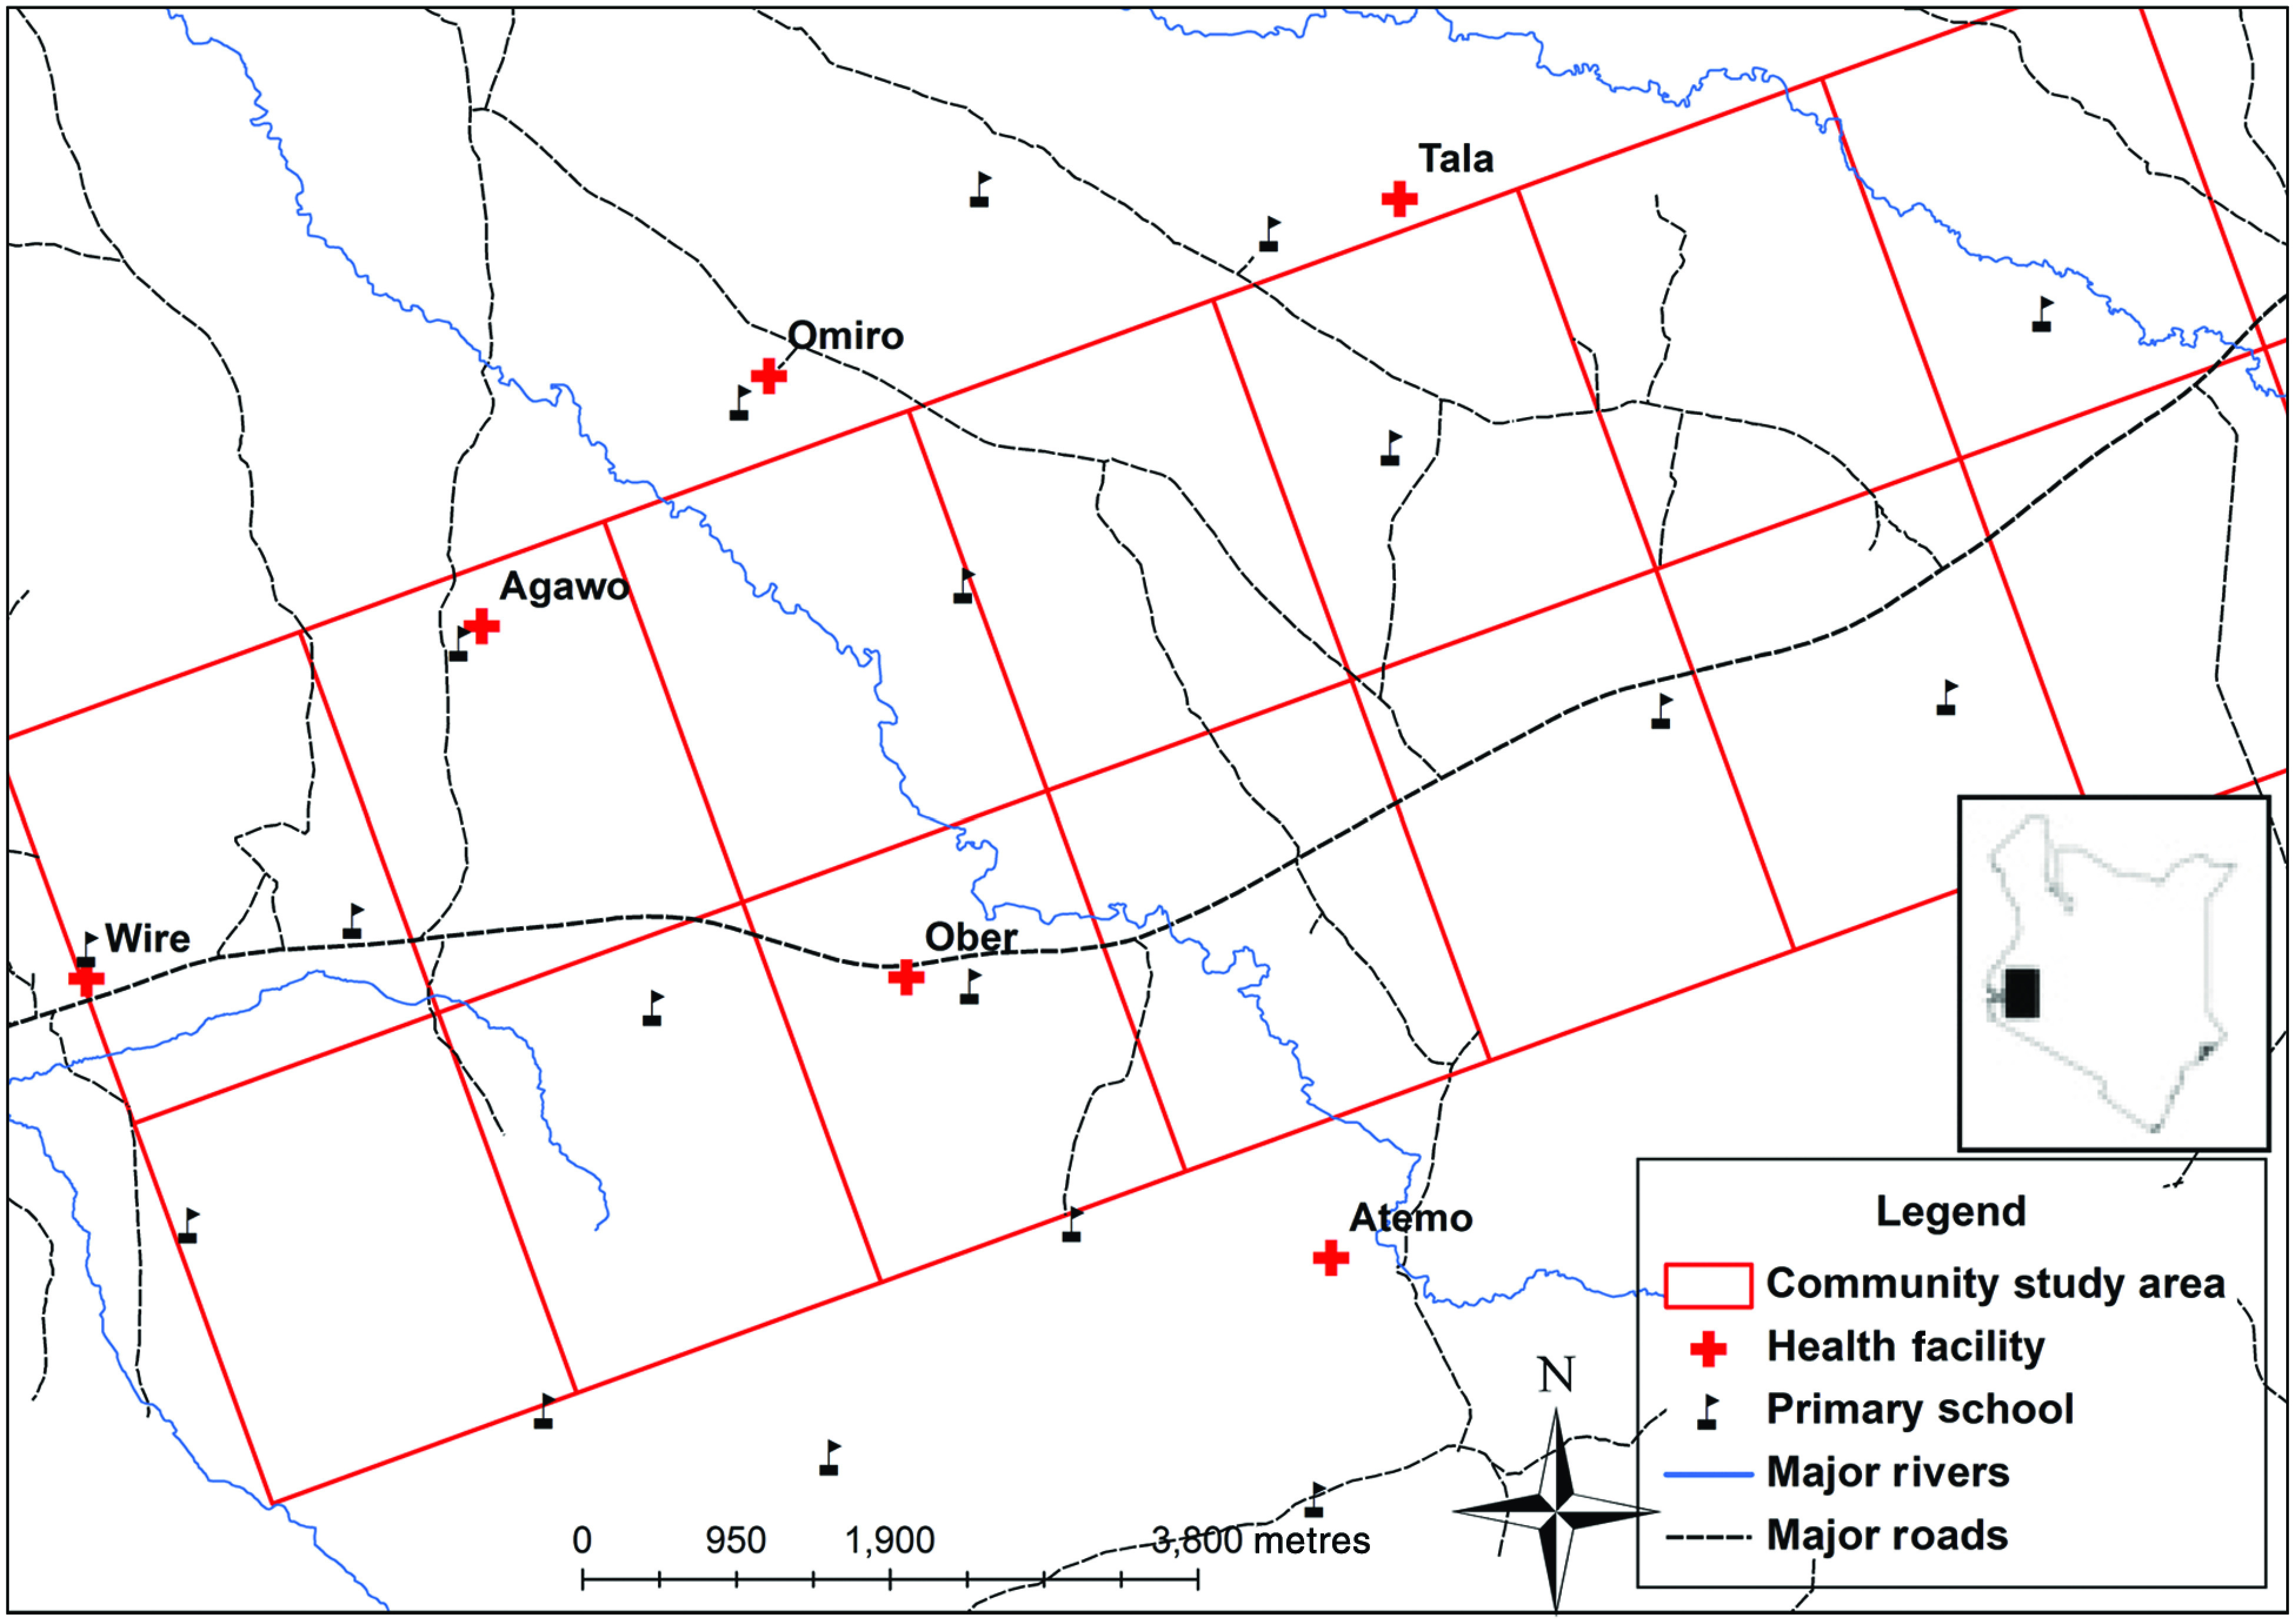
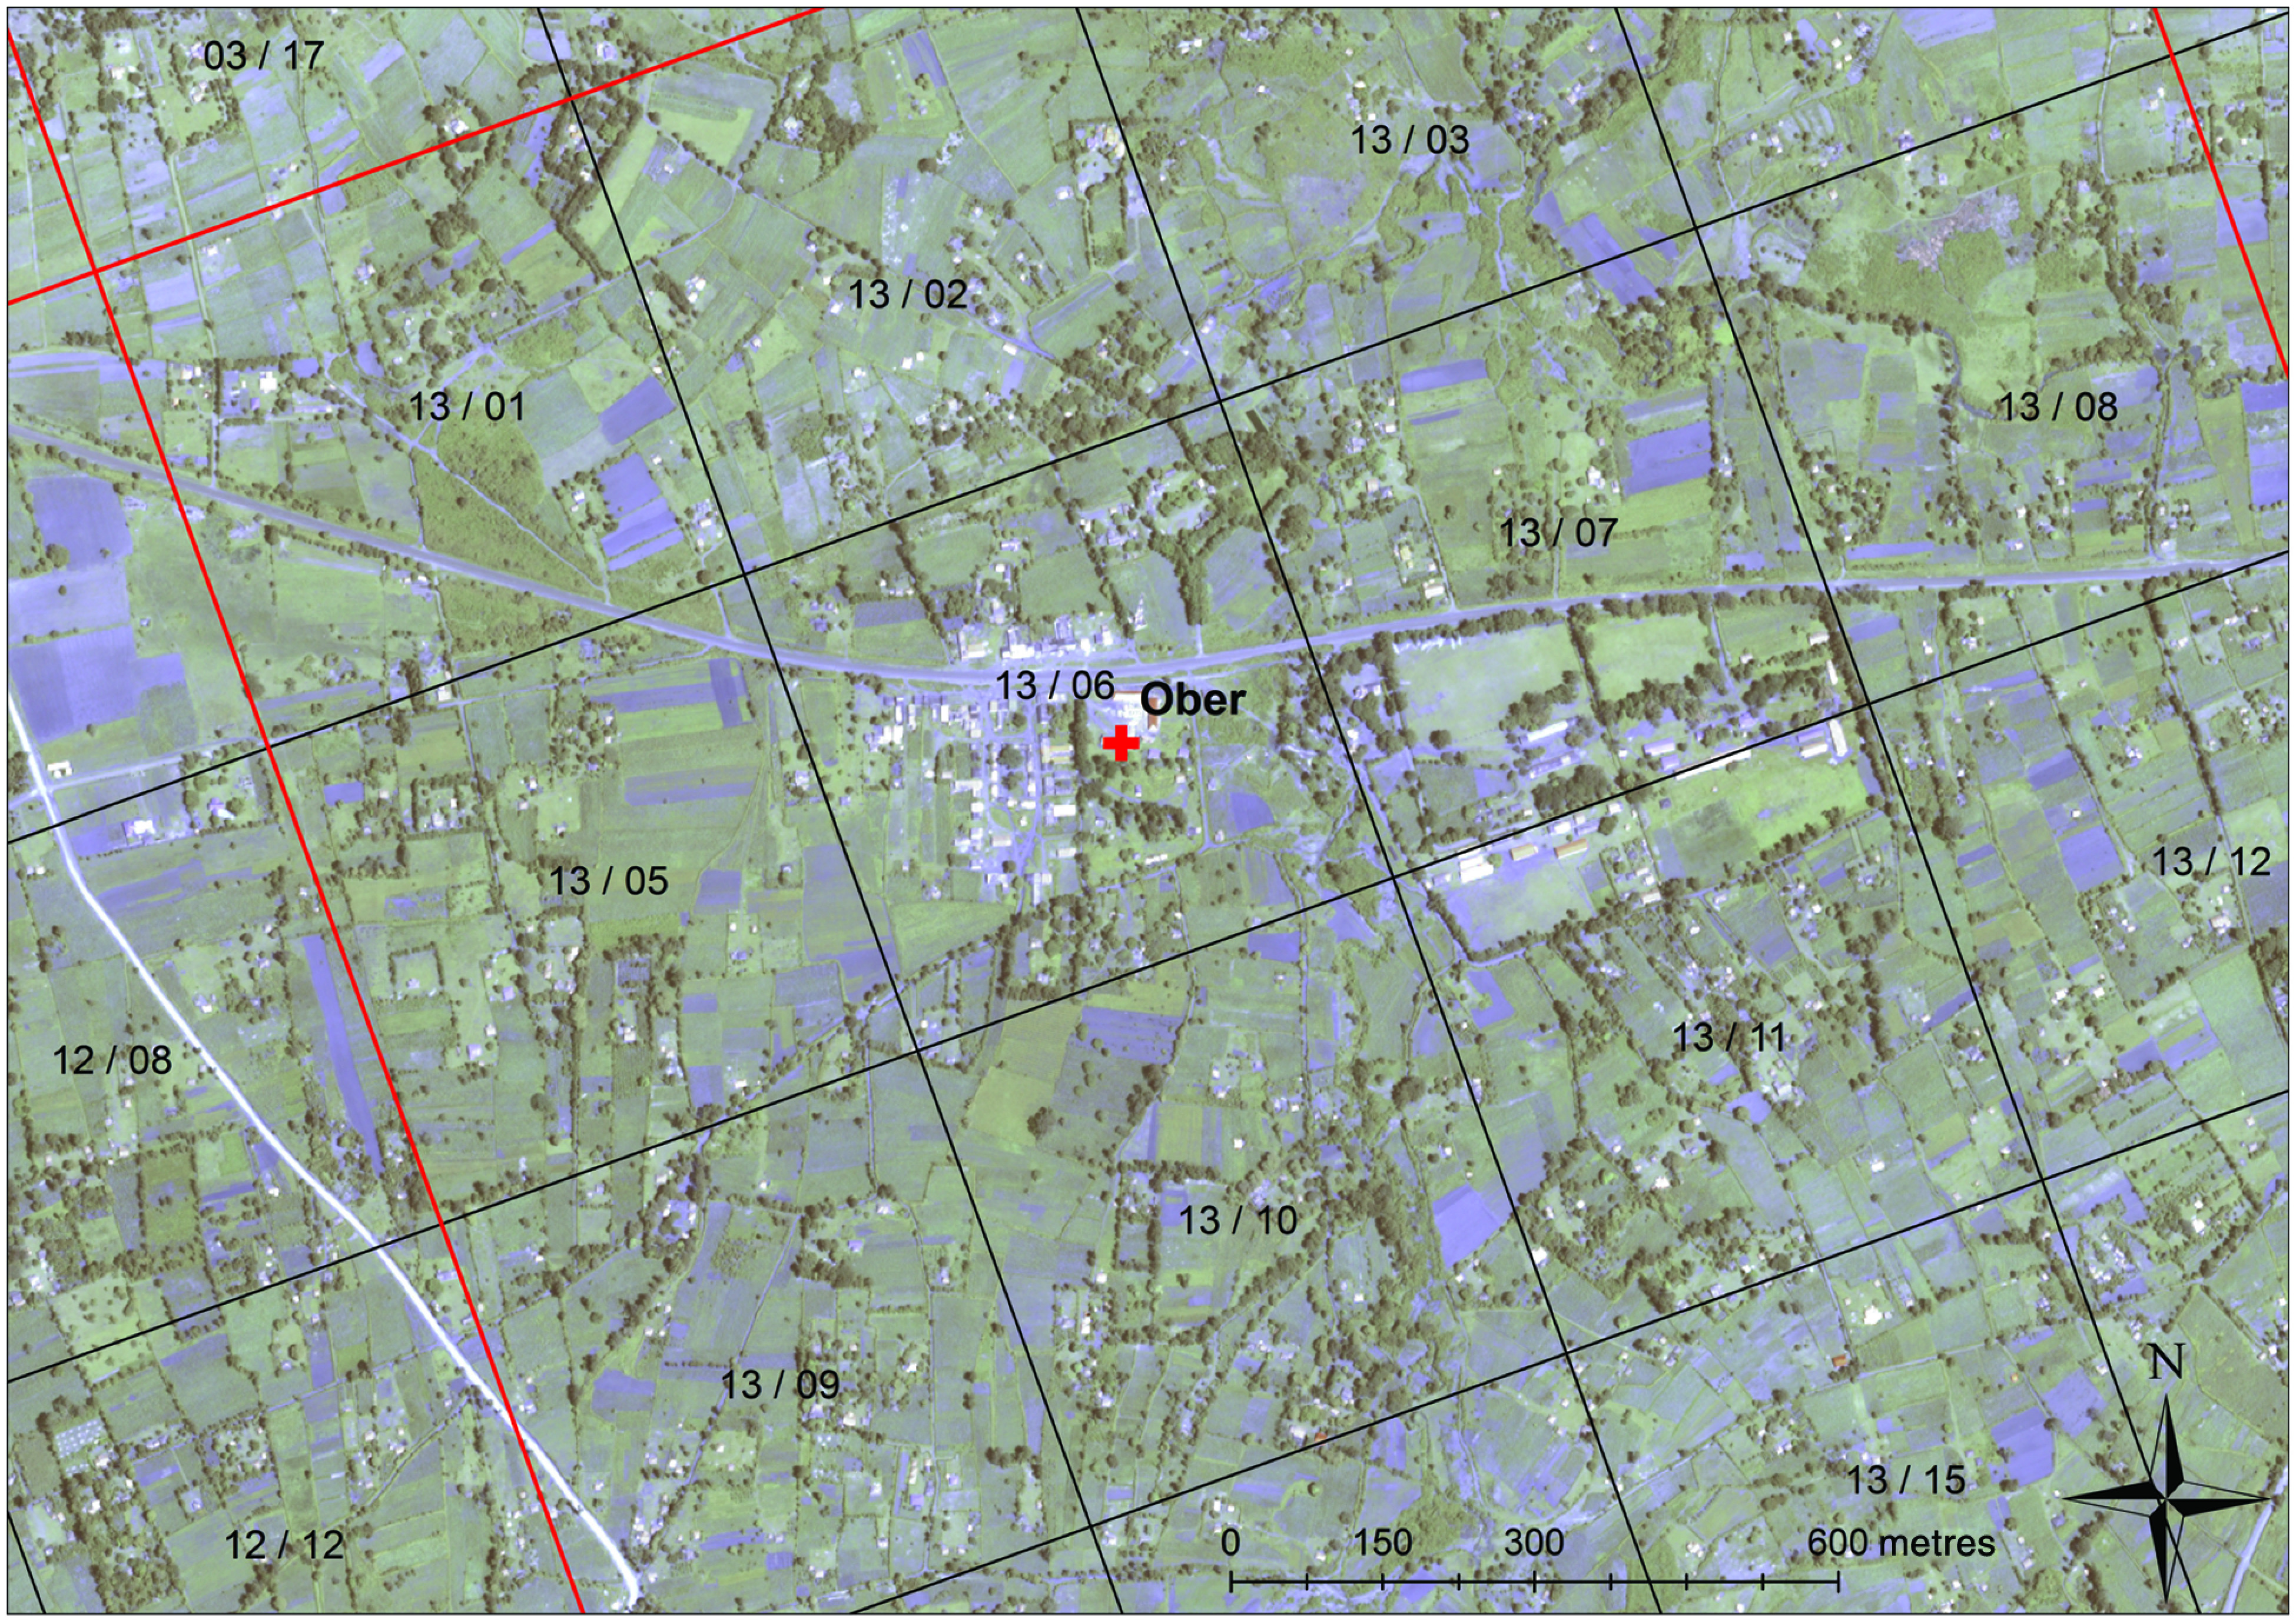
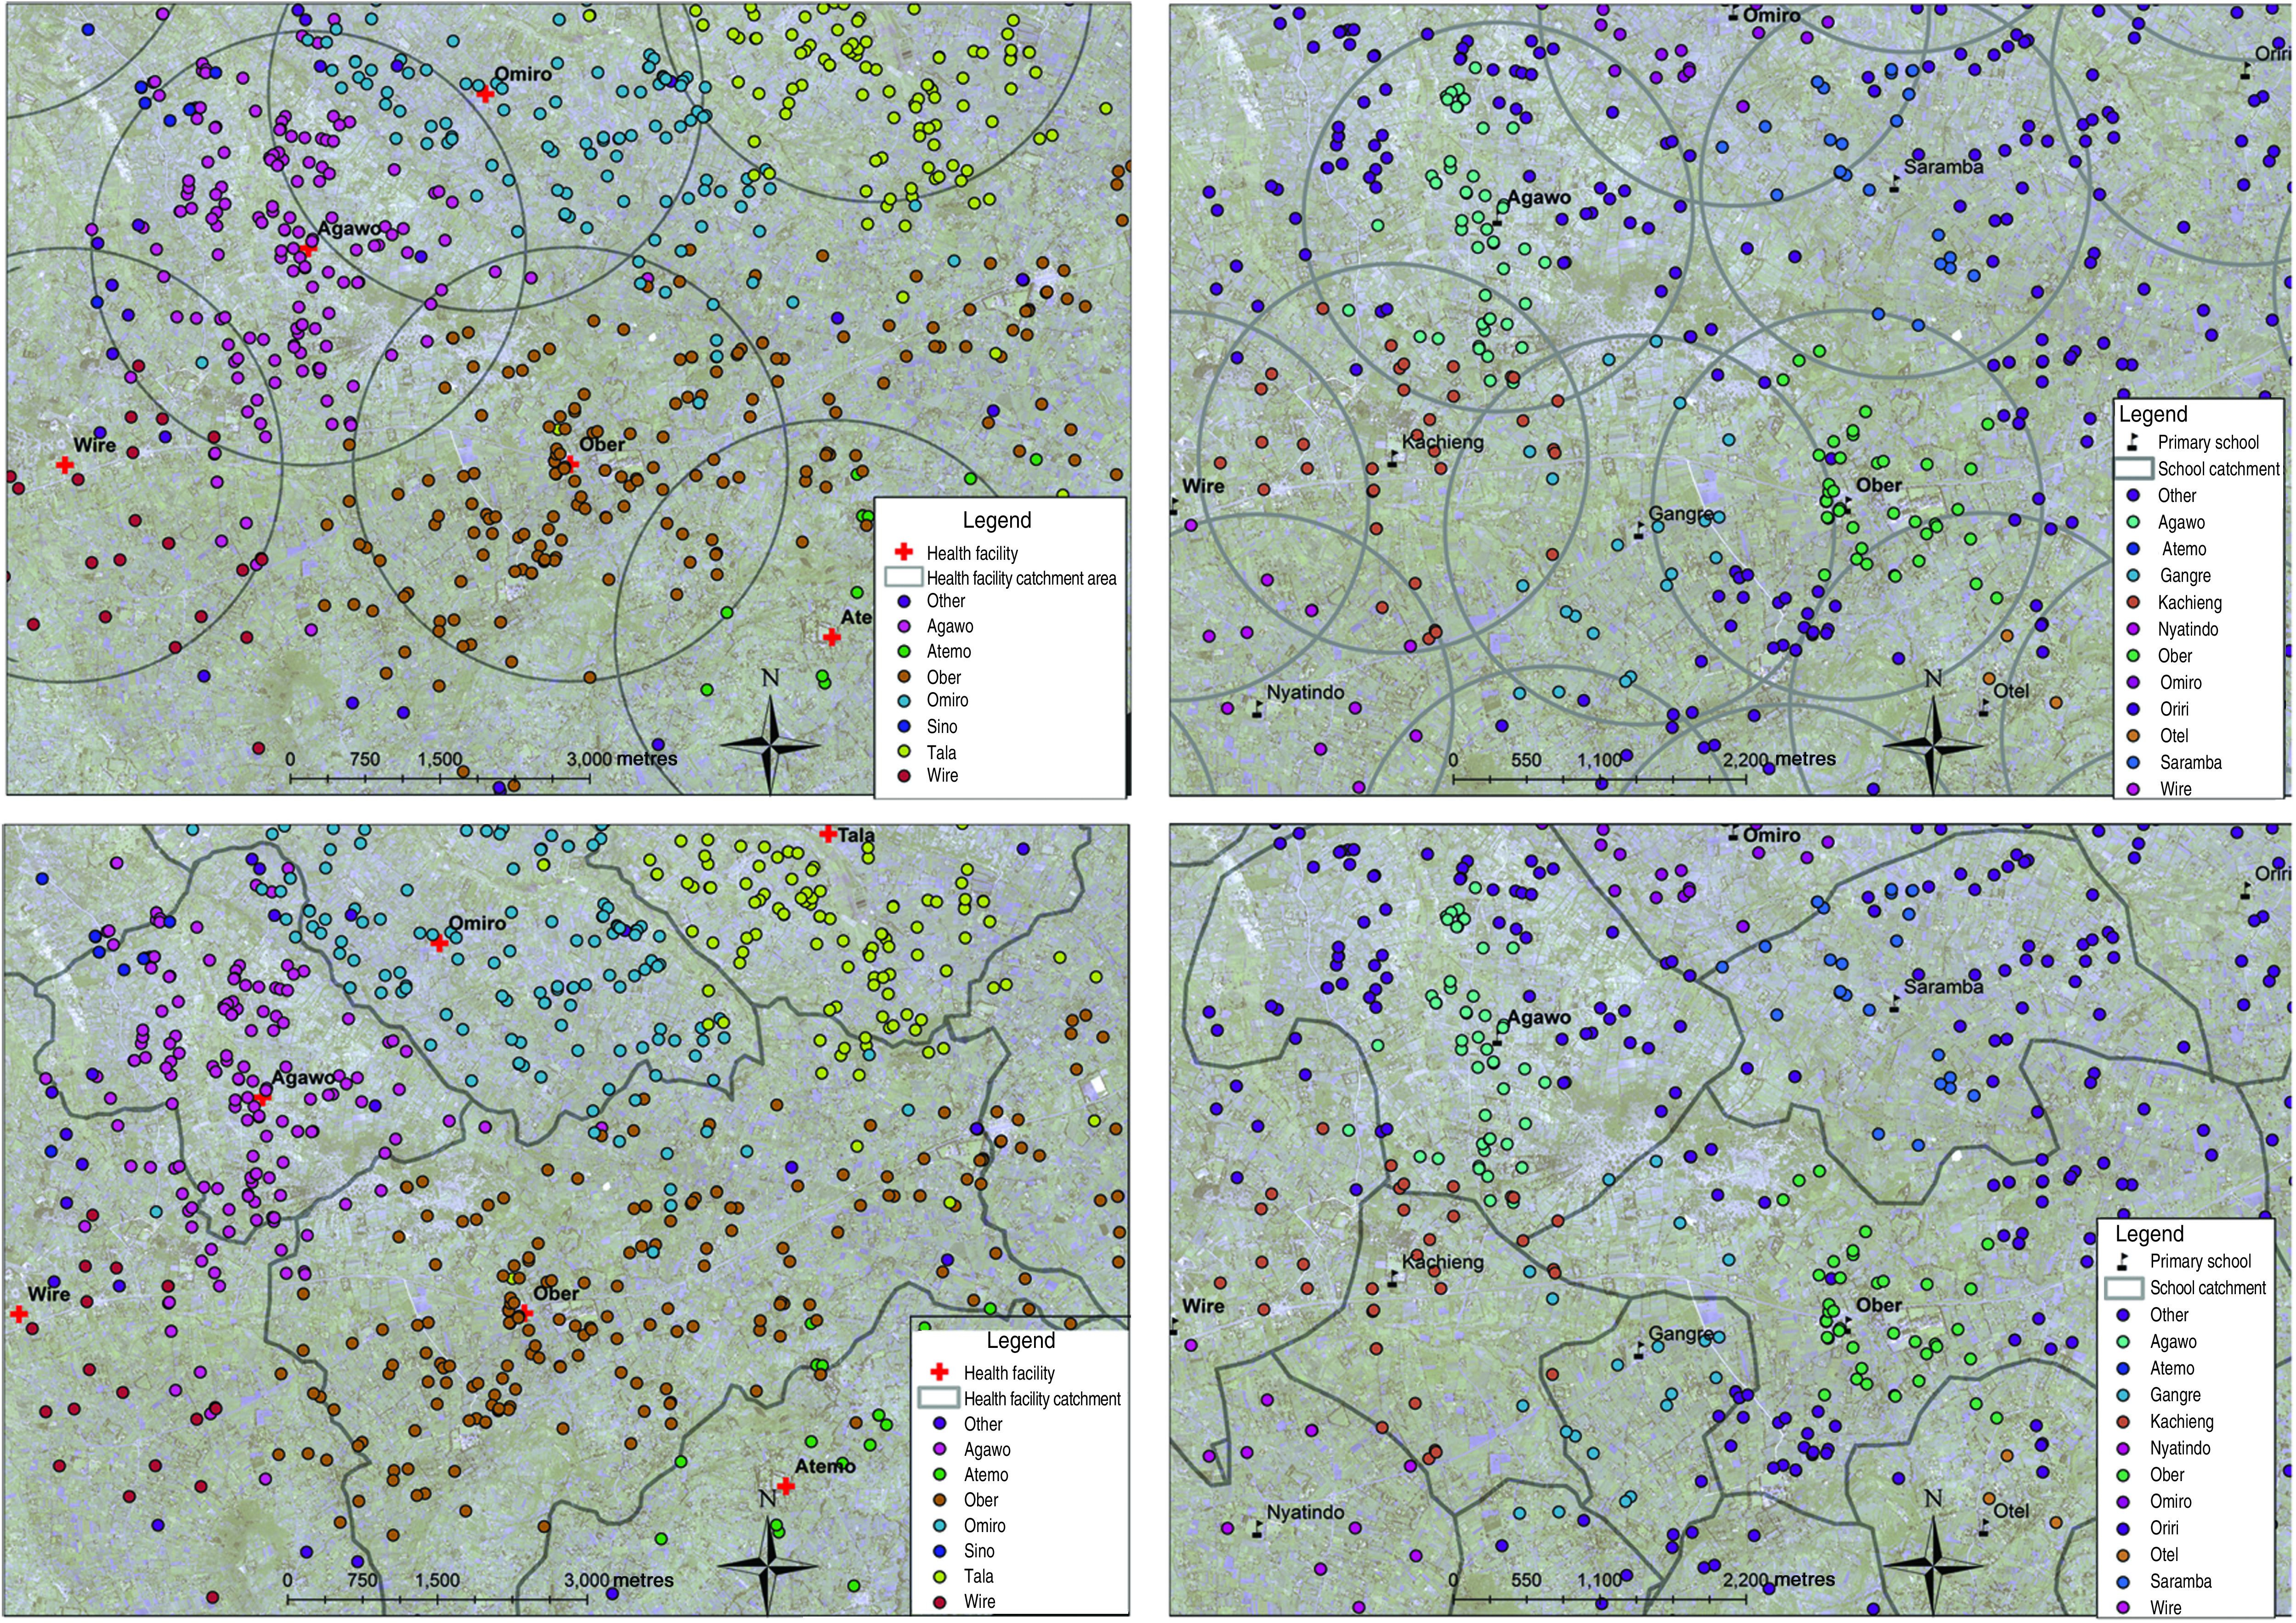
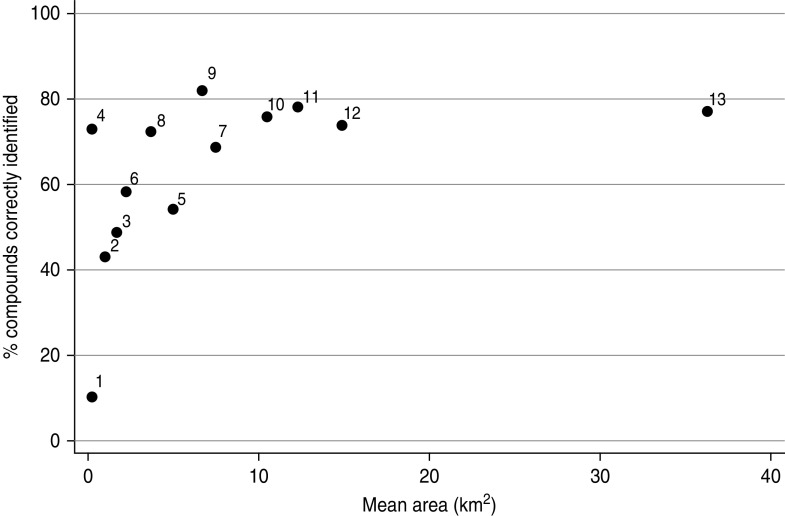
Understanding the spatial distribution of disease is critical for effective disease control. Where formal address networks do not exist, tracking spatial patterns of clinical disease is difficult. Geolocation strategies were tested at rural health facilities in western Kenya. Methods included geocoding residence by head of compound, participatory mapping and recording the self-reported nearest landmark. Geocoding was able to locate 72·9% [95% confidence interval (CI) 67·7-77·6] of individuals to within 250 m of the true compound location. The participatory mapping exercise was able to correctly locate 82·0% of compounds (95% CI 78·9-84·8) to a 2 × 2·5 km area with a 500 m buffer. The self-reported nearest landmark was able to locate 78·1% (95% CI 73·8-82·1) of compounds to the correct catchment area. These strategies tested provide options for quickly obtaining spatial information on individuals presenting at health facilities.


Figures

Fig. 1
Fig. 1
[colour online]. Map of the study area, Rachuonyo South, Kenya (2011–2012), showing the main roads (dashed lines), rivers (solid lines), location of schools (flags) and health facilities (crosses).
Fig. 2.
Fig. 2.
Participatory mapping example showing the grid of blocks and cells that were overlain on satellite imagery. The red lines outline the block and block numbers are shown. The cells are outlined by the black lines within each block and are counted from 1 to 20 starting with the upper left corner and counting from left to right (i.e. 13/01 to 13/20).
Fig. 3.
Fig. 3.
Examples of the catchment areas and the spatial distribution of responses for self reported nearest landmark for the Euclidian and cost-distance models, South Rachuonyo, Kenya, 2011–2012. (a) Health-facility catchment based on Euclidian distance model; (b) primary school catchment based on Euclidian distance model; (c) health-facility catchment area based on cost-distance model; (d) school catchment area based on cost-distance model.
Fig. 4.
Fig. 4.
Scatter plot showing the summarized results of all geolocation strategies tested with the precision (mean area) of the approach plotted against the accuracy (% of compounds correctly located): 1, cell [participatory mapping (PM)]; 2, cell (>500 m) (PM); 3, combined health facility (HF) & primary school (PS) (Euclidian distance; ED) [nearest landmark (NL)]; 4, geocoding; 5, block (PM); 6, cell (>1000 m) (PM); 7, block (>500 m) (PM); 8, combined HF & PS (cost-distance; CD) (NL); 9, PS (ED) (NL); 10, block (>1000 m) (PM); 11, PS (CD) (NL); 12, HF (ED) (NL); 13, HF (CD) (NL).

Similar articles

Cited by

References

    1. Schimmer B, et al. The use of a geographic information system to identify a dairy goat farm as the most likely source of an urban Q-fever outbreak. BMC Infectious Diseases 2010; 10: 69. - PMC - PubMed
    1. Gatto M, et al. Generalized reproduction numbers and the prediction of patterns in waterborne disease. Proceedings of the National Academy of Sciences USA 2012; 109: 19703–19708. - PMC - PubMed
    1. Breban R, Riou J, Fontanet A. Interhuman transmissibility of Middle East respiratory syndrome coronavirus: estimation of pandemic risk. Lancet 2013; 382: 694–699. - PMC - PubMed
    1. Cauchemez S, et al. Using routine surveillance data to estimate the epidemic potential of emerging zoonoses: application to the emergence of US swine origin influenza A H3N2v virus. PLoS Medicine 2013; 10: e1001399. - PMC - PubMed
    1. Noor AM, et al. A spatial national health facility database for public health sector planning in Kenya in 2008. International Journal of Health Geography 2009; 8: 13. - PMC - PubMed

Publication types

MeSH terms