. 2014 May 1;10(5):e1004319.
doi: 10.1371/journal.pgen.1004319. eCollection 2014 May.

Allele-specific genome-wide profiling in human primary erythroblasts reveal replication program organization

Affiliations

Allele-specific genome-wide profiling in human primary erythroblasts reveal replication program organization

Rituparna Mukhopadhyay et al. PLoS Genet. .

Abstract

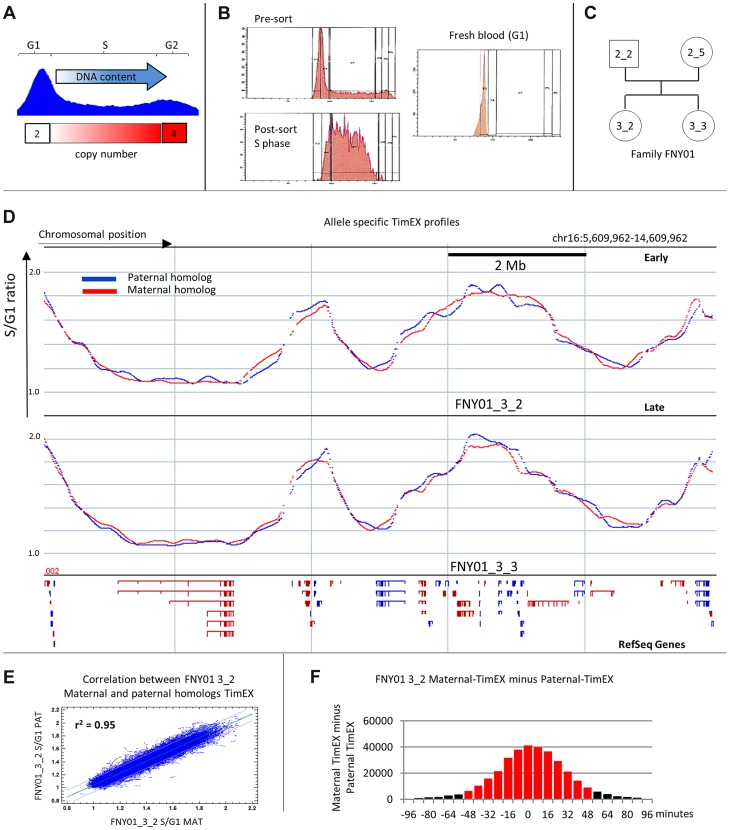
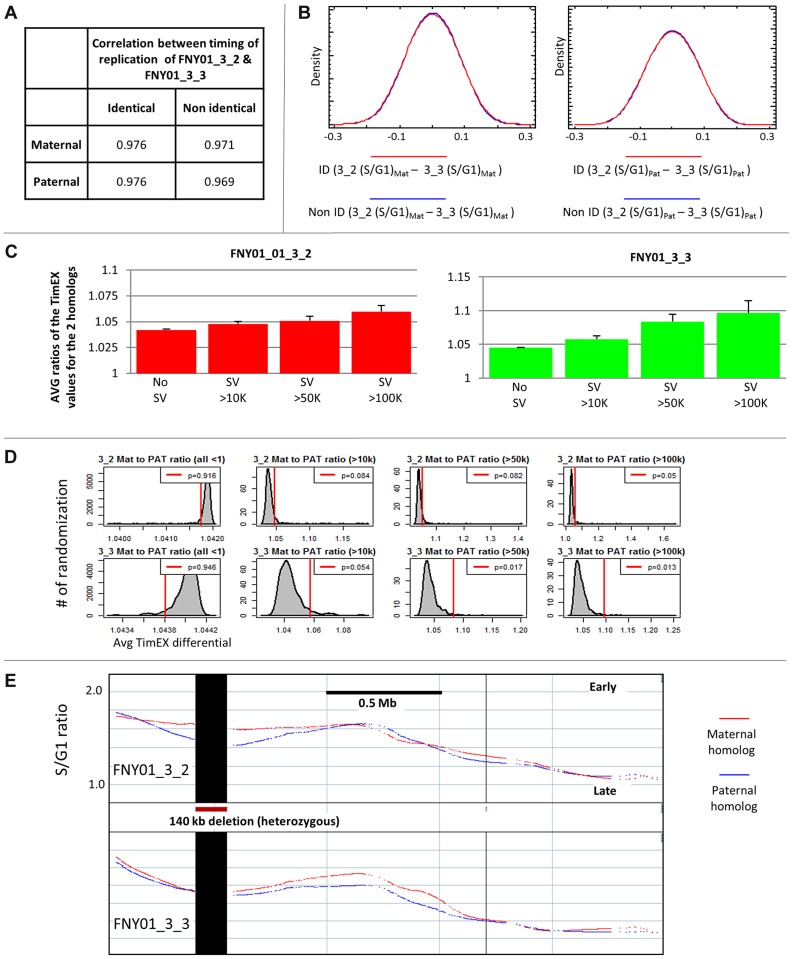
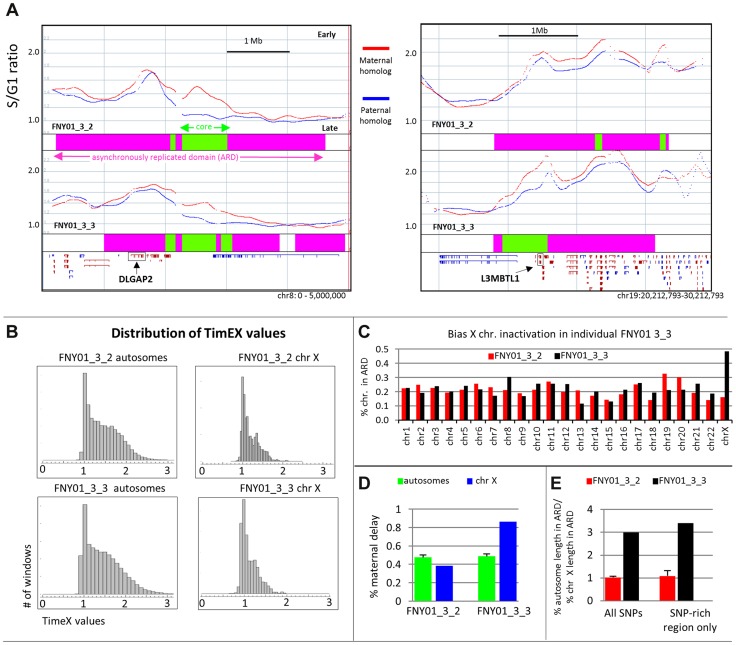
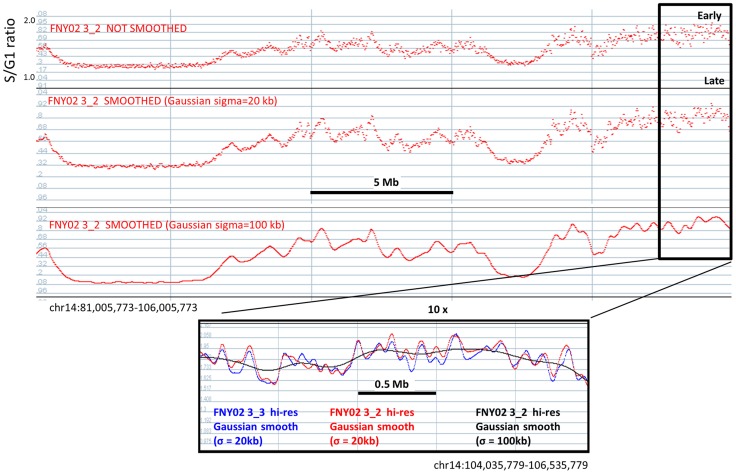
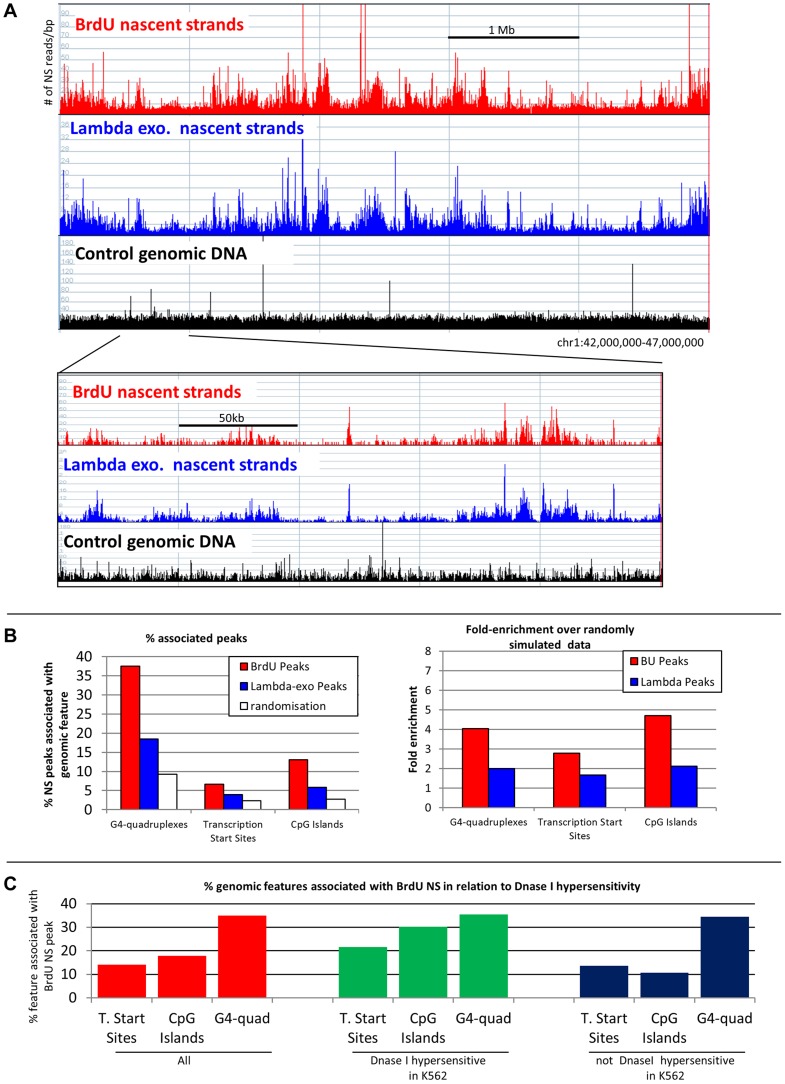
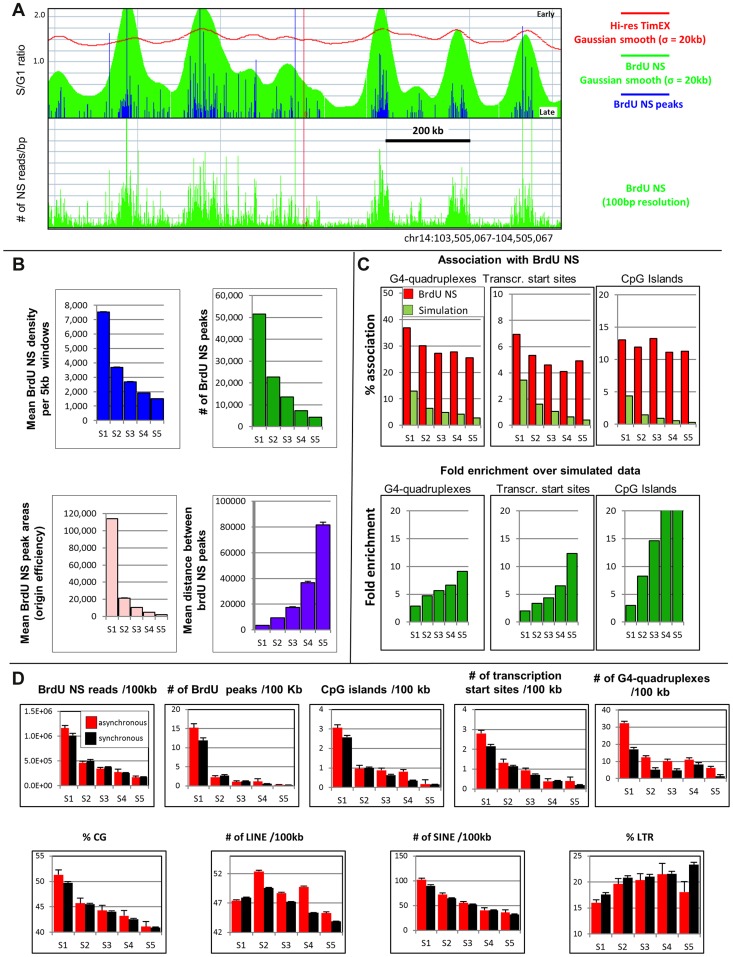
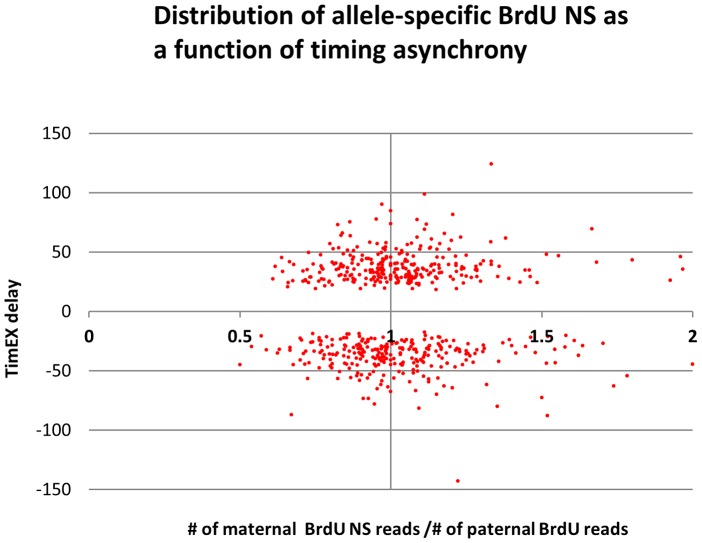
We have developed a new approach to characterize allele-specific timing of DNA replication genome-wide in human primary basophilic erythroblasts. We show that the two chromosome homologs replicate at the same time in about 88% of the genome and that large structural variants are preferentially associated with asynchronous replication. We identified about 600 megabase-sized asynchronously replicated domains in two tested individuals. The longest asynchronously replicated domains are enriched in imprinted genes suggesting that structural variants and parental imprinting are two causes of replication asynchrony in the human genome. Biased chromosome X inactivation in one of the two individuals tested was another source of detectable replication asynchrony. Analysis of high-resolution TimEX profiles revealed small variations termed timing ripples, which were undetected in previous, lower resolution analyses. Timing ripples reflect highly reproducible, variations of the timing of replication in the 100 kb-range that exist within the well-characterized megabase-sized replication timing domains. These ripples correspond to clusters of origins of replication that we detected using novel nascent strands DNA profiling methods. Analysis of the distribution of replication origins revealed dramatic differences in initiation of replication frequencies during S phase and a strong association, in both synchronous and asynchronous regions, between origins of replication and three genomic features: G-quadruplexes, CpG Islands and transcription start sites. The frequency of initiation in asynchronous regions was similar in the two homologs. Asynchronous regions were richer in origins of replication than synchronous regions.


Conflict of interest statement

The authors have declared that no competing interests exist.

Figures

Figure 1
Figure 1. Allele specific timing profiles.
A: Principle of the TimEX methods: DNA content from cells in the G1 and S phases of the cell cycle is compared. Cells in G1 contain 2 copies of each genomic region. By contrast, cells in S contain between 2 and 4 copies of each genomic regions and the number of copies in S is inversely proportional to replication timing. The S/G1 ratio can therefore be used as a surrogate for replication timing. B: Histograms representing the DNA content profiles of exponentially growing cultured basophilic erythroblasts (presort), of the same cells after sorting the S phase fraction (post sort) and of circulating white blood cells that are almost exclusively in the G1 phase of the cell cycle. Cells were labeled with Propidium iodide for 15 minutes. C: Pedigree of family FNY01. D. Plots illustrating the replication timing of the maternal and paternal homologs in a 10 Mb region on chr16 for FNY01 3_2 and 3_3. The data was generated by binning the read depth of heterozygous SNPs in 500 bp windows, applying a Gaussian smoothing filter (sigma = 100 kp) and calculating the S/G1 ratio for the maternal and the paternal homologs. The profiles are discontinuous because some reion of the genome did not contains any heterozygous SNPs. Replication of the homologs is tightly regulated. The location of Refseq genes is indicated below the timing profiles to give a sense of scale. E: Scatter-plots of the S/G1 ratios of the allele-depth of heterozygous SNPs in 5 kb windows for the maternal and paternal homologs. Coefficient of correlation between the two homolog is very high (r2 = 0.95). F: Histogram of the distribution of the difference between the S/G1 ratio of the maternal and paternal homologs. The two homologs replicate within 48 minutes of each other in about 88% of the genome. The black bars represent the asynchronous regions.
Figure 2
Figure 2. Presence of large structural variants can alter replication timing regionally.
A: Comparison of the timing of replication in genetically identical and non-identical regions. Coefficients of correlation between the timing of replication of the two maternally inherited or the two paternally inherited chromosomes calculated in 500 bp windows in the identical and non-identical regions of the genome of FNY01 3_2 and 3_3. The timing of replication is very similar in the identical and non-identical regions. B: left panel: Density traces of the differences between the mean-centered TimEX values of the maternal homologs in individuals FNY01_3_2 and 3_3 in the identical (ID) and non-identical (Non ID) regions. Differences were calculated in 500 bp windows. The timing of replication of the maternally inherited chromosomes of FNY01 3_2 and 3_3 are as closely related to each other is the non-identical and identical regions. Right panel: same but for the paternal homologs. C: Histograms illustrating the mean (± S.E.M) of the avg timing of replication differential of the paternal and maternal homologs in 500 kb intervals containing either no SVs greater than 10 Kb (No SVs), or SVs larger than 10, 50 and 100 kb for individual FNY01_3_2. For each 500 kb interval, the timing differential was calculated as the average of the S/G1 ratio computed in 5 kb windows after inversion of the ratios smaller than one to capture the absolute value of the timing differential. Similar results were obtained using intervals of 1 Mb, using overlapping or non-overlapping intervals, and calculating the timing differential as log ratio, as a difference or as or as distance between the allelic TimEX values. Timing is highly synchronous in the 500 kb intervals containing no SVs and in the identical and non-identical regions. By contrast, regions containing SVs exhibit larger and larger differences between the replication times of the two homologs as the size of the SV increases. D: Statistical significance of the influence of SVs on timing of replication. Location of the SVs in the genome was randomized and the average timing differentials were calculated as above. Histograms summarize the average timing differential observed for 100,000 randomizations. P-values were calculated as the fraction of randomization that yielded average timing differential higher than the observed differential, Red lines represent the timing differential observed with the actual data. E: An asynchronously replicated region associated with a 140 kb deletion that is heterozygous in both FNY01 3_2 and 3_3.
Figure 3
Figure 3. Large asynchronously replicated region contains imprinted genes.
A: Plots illustrating two large asynchronously replicating regions containing two paternally imprinted genes DLGAP2 and L3MBTL1 in FNY01_3_2 (top) and 3_3 (bottom). The blue and red curves respectively represent the TimEX profiles of the paternal and maternal homologs (S/G1 copy number ratios after Gaussian smoothing (sigma = 100 Kb)). The pink boxes below the curve illustrate the Asynchronously Replicated Domains (ARD); the green boxes, the core ARD. Refseq genes are plotted to indicate the location of the imprinted genes. B: Histogram illustrating the distribution of the TimEX values for the autosomes and the X chromosomes. As expected, the distribution of the values for the autosomes is broader than for the sex chromosomes because one of the X chromosomes replicates uniformly late. C: Histogram illustrating the fraction of the length of each chromosome that is within an ARD region. This fraction varies between 0.1 and 0.3 for all chromosomes except for the X chromosome of individual FNY01_3_3 which contains ARD for almost half of its length. D: Histogram illustrating the fraction of ARD that exhibited a maternal delay for the autosome and for the sex chromosomes. Paternal and maternal delays are approximately equally distributed in all autosomes and in the X chromosome of FNY01_3_2. By contrast almost 90% of the ARD in chromosome X of FNY01_3_3 exhibit a maternal delay. E: Histogram illustrating the ratios of the percentages of the length of the autosome that is asynchronously replicated to the percentage of the X chromosome that is asynchronously replicated in FNY01_3_2 and 3_3 considering all the SNPs or only the SNPs rich regions. The imbalance in the percent X chromosome that is inactivated of FNY01_3_3 can be detected even when only the SNP-rich regions are taken into consideration. Together Figure 3B to 3E strongly suggest that X inactivation in the erythroid lineage of individual FNY01_3_3 is biased toward the maternal chromosome which is inactivated more often than the paternal chromosome.
Figure 4
Figure 4. Hi-resolution TimEX-seq analysis reveals the fine structure of the timing domains.
25-resolution TimEX profiles. Top panel: S/G1 ratios calculated every 1 kb are plotted. At this read depth, the shape of the timing domains can be distinguished without any smoothing. Middle and bottom panel: same data after Gaussian smoothing using sigma = 20 Kb or 100 kb. Smoothing at 100 kb, which was necessary to obtain reproducible profiles after read-depth at a low read depth or with micro-array based methods, reveals the major timing domains but smooth the details out. Inset: red curve: TimEX profile after 20 Kb Gaussian smoothing for individual FNY01 3_2; black curve: same data after 100 kb Gaussian smoothing; blue curve: TimEX profile for individual FNY01 3_3 after 20 kb Gaussian smoothing. Note the reproducibility sub-peaks or ripples in the profiles of FNY01 3_2 and 3_3 and how the 100 kb processing masks the details.
Figure 5
Figure 5. NS profiles.
A: Comparison of NS prepared using the lambda-exonuclease and BrdU methods. Profiles of newly replicated NS DNA in a 5 million bases pair region on chr 1 (250,000 for lower panel). Red bars: NS 0.5 to 1 kb in length were isolated by immuno-precipitation of newly replicated DNA labeled with BrdU. Blue bars: NS prepared using the lambda exo-nuclease method. Black bars: Sheared genomic DNA (mapability control) B: NS peaks are associated with 3 genomic features: left panel: histograms illustrating the association of G-quadruplexes, transcription start sites and CpG islands with nascent strand peaks generated by the BrdU (red bars) or by the lambda exonuclease (blue bars) methods. Bootstrap (white bars) = average association with randomly simulated data (100–1000 iteration gave the same results). Y-axis = percent BrdU NS peaks associated with a feature (100× # of NS peaks associated with feature/# of NS peaks). Right panel: enrichment over bootstrap: Y axis = (% associated peaks/% associated random peaks). C: Chromatin accessibility favors the formation of origins of replication at G-quadruplexes, transcription start sites and CpG islands: Red bars represent the percent of G-quadruplexes, transcription start sites and CpG islands that are associated with a BrdU NS peaks. Green and blue bars respectively represent the percent of G-quadruplexes, transcription start sites and CpG islands that are (green) or are not (blue) located within a DNase I hypersensitive site and that are associated with a BrdU NS peaks. DNase I hypersensitivity data is from K562 cells. Y-axis = % features associated with BrdU NS peaks.
Figure 6
Figure 6. Comparison of TimEX and BrdU nascent strands profiles.
A: Correlation of TimEX-seq and NS profiles: Top panel: Red curve TimEX-seq profile in a 1 Mb region of chr. 14 (Avg of the S/G1 values of FNY01 3_2 and 3_3). Green histogram: BrdU nascent strand smooth with Gaussian filter (σ = 20 kb). Blue histograms: Top 100,000 called nascent strand peaks. Bottom panel: BrdU NS profile in same region at 100 bp resolution. The timing peaks co-localize with clusters of BrdU NS. B: Top left panel: mean NS density per 5 kb window during S phase progression (S1 to S5 fractions were computed on the combined TimEX profiles of individuals FNY01 3_2 and 3_3). Top right panel: number of NS peaks in fractions S1 to S5. Bottom left panel: average NS peak area in fractions S1 to S5. Bottom right panel: mean distance between NS peaks. C: Association of BrdU NS with G-quadruplexes, transcription starts sites and CpG Islands. Association between BrdU NS peaks and these three genomic features occurs throughout S phase, even in S5 phase where very little transcription occurs. Top panels: Y-axis = % BrdU NS peaks associated with G-quadruplexes, transcription starts sites or CpG Islands. Bootstrap = average of the results of 100 random simulations. Bottom panels: Y-axis = fold-enrichment over average results of 100 random simulations. D: Analysis of asynchronous regions. The combined data from FNY01_3_2 and 3_3 analysis are illustrated. Similar results were observed when the data from FNY01_3_2 and 3_3 were analyzed separately. The top histograms from left to right respectively represent the density of BrdU NS reads/kb; the number of BrdU peaks/Mb; the number of CpG islands/100 kb, the number of transcription start sites/100 kb and the number of G-quadruplexes/100 kb as a function of replication time. The bottom histograms from left to right respectively represent the percent CG, LINE, SINE and LTR as a function of replication time. CG content was calculated in 10 kb interval using a 100 kb moving average window. The percent LINE, SINE and LTR was calculated as 100×(number of repeat base)/kb. The error bars represent the standard deviation of the mean.
Figure 7
Figure 7. Distribution of allele-specific BrdU NS as a function of timing asynchrony.
X-axis = # of maternal NS reads/# of paternal NS reads. Y axis = TimEX delay S/G1 ratio of maternal chromosome - S/G1 ratio of paternal chromosome. Each point represents one of the ARD regions observed in the combined FNy01_3_2 and 3_3 data. Similar results when the data from FNY01_3_2 or 3_3 were analyzed separately or when only the top 100 significant ARD or the imprinted ARD were considered. There is no correlation between maternal and paternal TimEX differential and the density of maternal or paternal BrdU NS.

References

    1. Aladjem MI (2007) Replication in context: dynamic regulation of DNA replication patterns in metazoans. Nat Rev Genet 8: 588–600. - PubMed
    1. Masai H, Matsumoto S, You Z, Yoshizawa-Sugata N, Oda M (2010) Eukaryotic chromosome DNA replication: where, when, and how? Annu Rev Biochem 79: 89–130. - PubMed
    1. Leonard AC, Mechali M (2013) DNA replication origins. Cold Spring Harb Perspect Biol 5: a010116. - PMC - PubMed
    1. Mechali M (2010) Eukaryotic DNA replication origins: many choices for appropriate answers. Nat Rev Mol Cell Biol 11: 728–738. - PubMed
    1. Mechali M (2001) DNA replication origins: from sequence specificity to epigenetics. Nat Rev Genet 2: 640–645. - PubMed

Publication types