. 2014 Nov;71(22):4457-70.
doi: 10.1007/s00018-014-1629-9. Epub 2014 May 1.

Processing of heparanase is mediated by syndecan-1 cytoplasmic domain and involves syntenin and α-actinin

Affiliations

Processing of heparanase is mediated by syndecan-1 cytoplasmic domain and involves syntenin and α-actinin

Anna Shteingauz et al. Cell Mol Life Sci. 2014 Nov.

Abstract

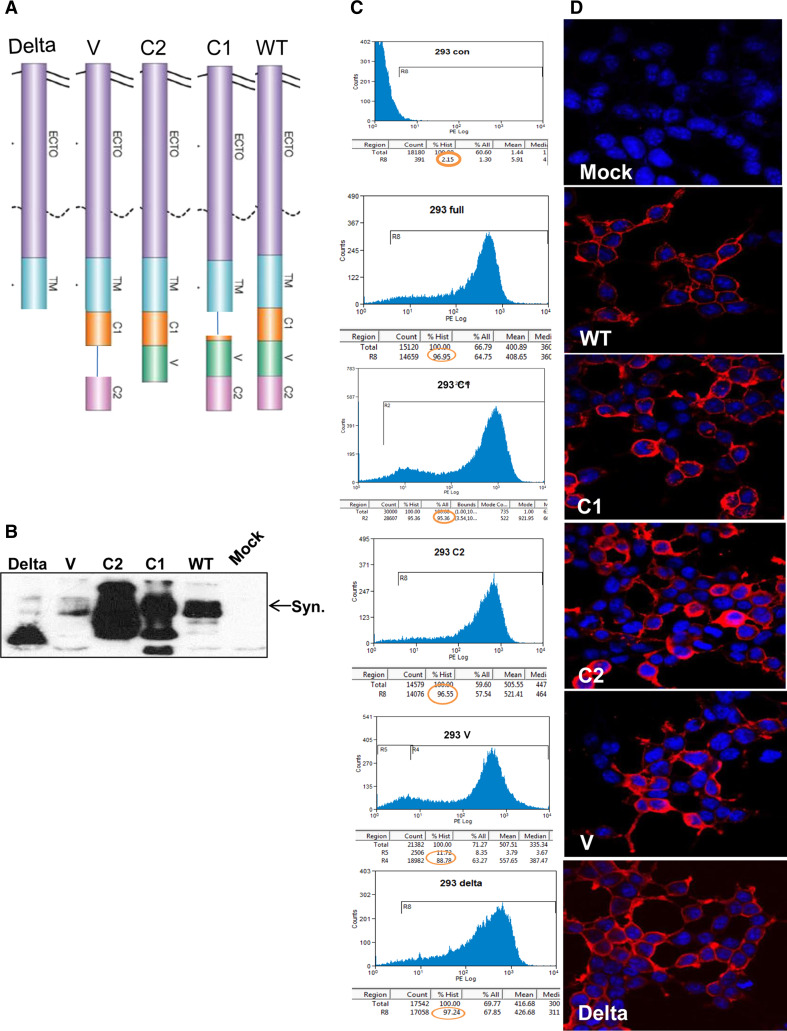
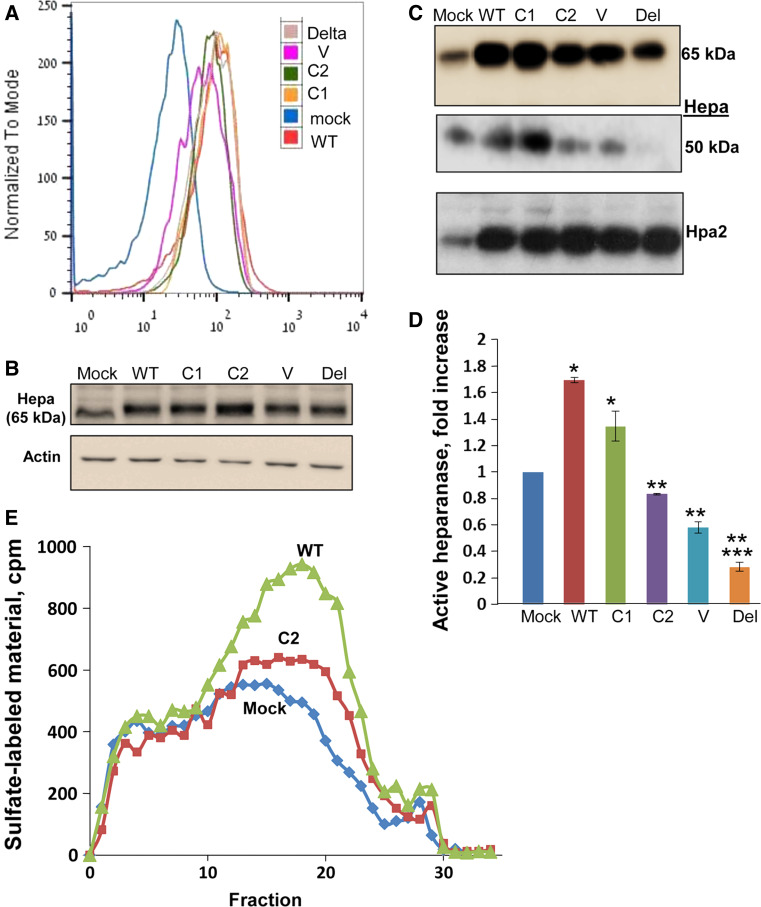
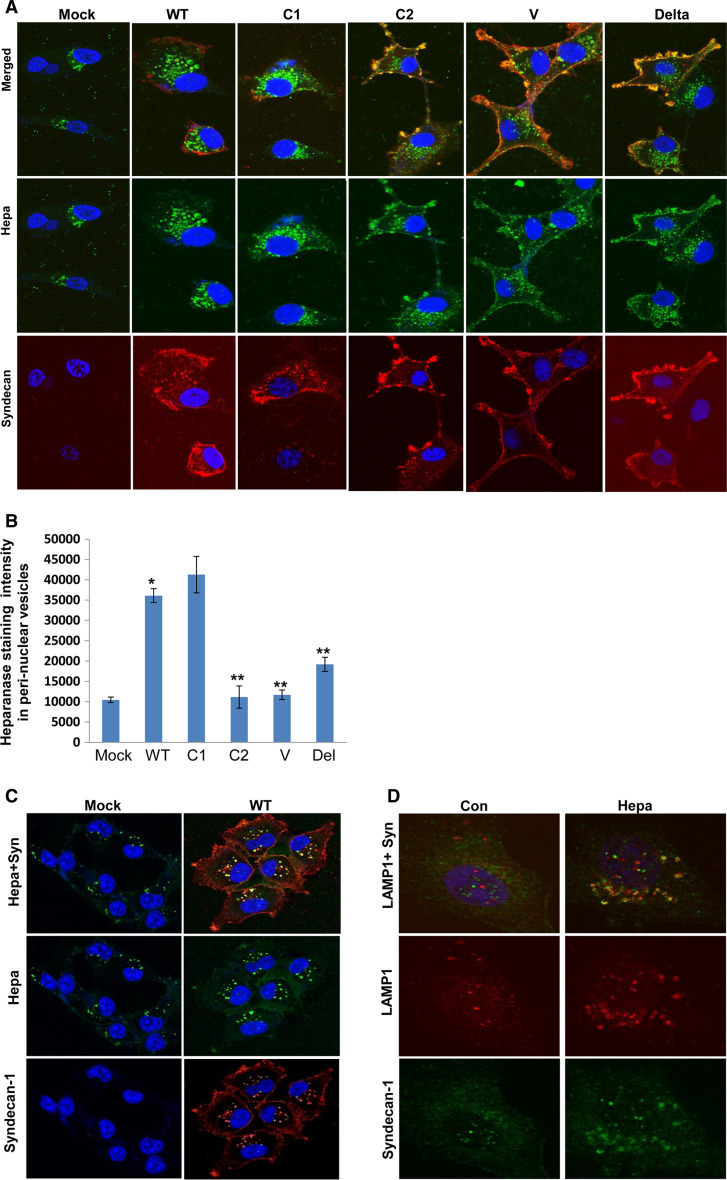
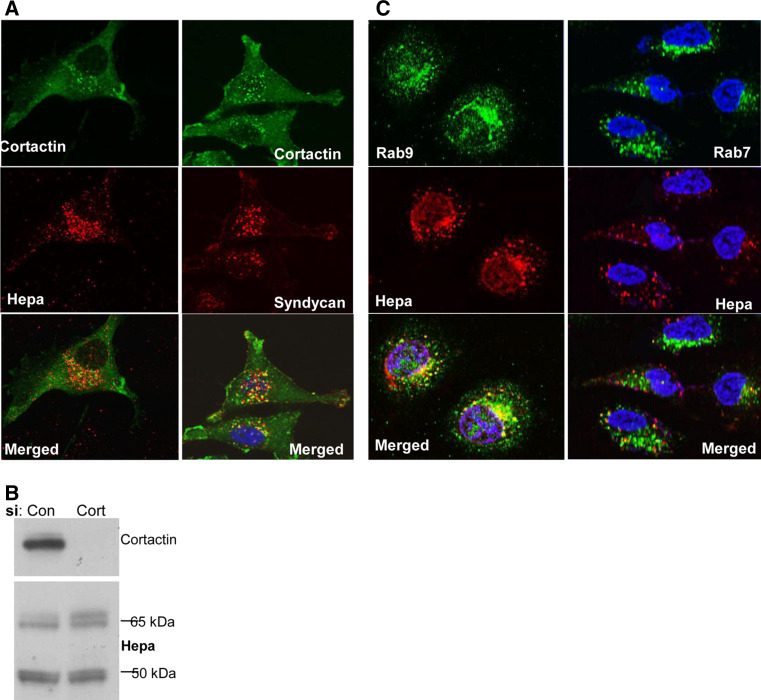
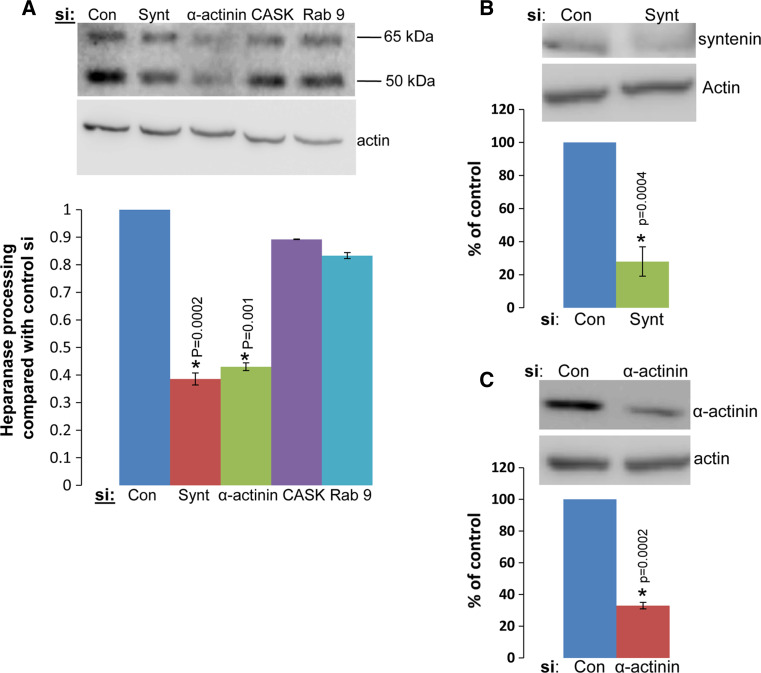
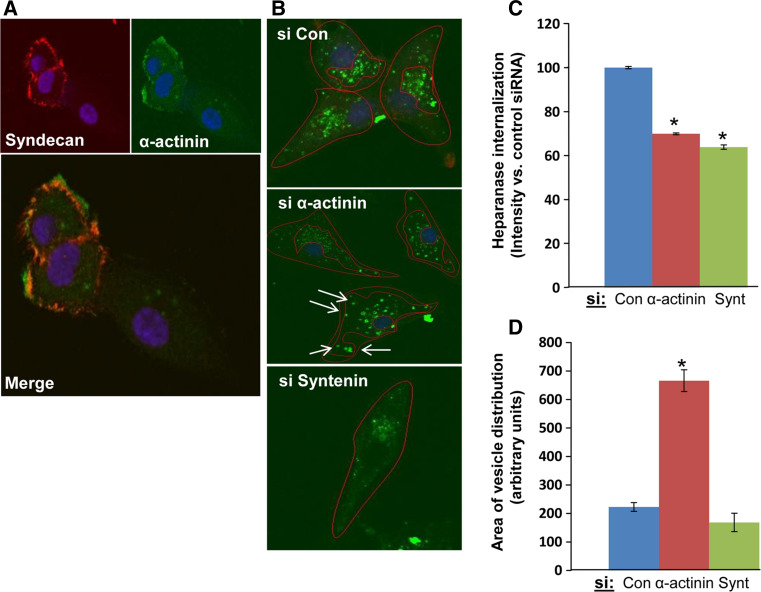
Heparanase activity plays a decisive role in cell dissemination associated with cancer metastasis. Cellular uptake of heparanase is considered a pre-requisite for the delivery of latent 65-kDa heparanase to lysosomes and its subsequent proteolytic processing and activation into 8- and 50-kDa protein subunits by cathepsin L. Heparan sulfate proteoglycans, and particularly syndecan, are instrumental for heparanase uptake and activation, through a process that has been shown to occur independent of rafts. Nevertheless, the molecular mechanism underlying syndecan-mediated internalization outside of rafts is unclear. Here, we examined the role of syndecan-1 cytoplasmic domain in heparanase processing, utilizing deletion constructs lacking the entire cytoplasmic domain (Delta), the conserved (C1 or C2), or variable (V) regions. Heparanase processing was markedly increased following syndecan-1 over-expression; in contrast, heparanase was retained at the cell membrane and its processing was impaired in cells over-expressing syndecan-1 deleted for the entire cytoplasmic tail. We have next revealed that conserved domain 2 (C2) and variable (V) regions of syndecan-1 cytoplasmic tail mediate heparanase processing. Furthermore, we found that syntenin, known to interact with syndecan C2 domain, and α actinin are essential for heparanase processing.


Figures

Fig. 1
Fig. 1
Syndecan-1 gene constructs and expression. a Schematic diagram of syndecan-1 gene constructs utilized in this study. bd Syndecan-1 expression. b 293 cells were stably transfected with the mouse syndecan-1 gene constructs and expression levels were evaluated by immunoblotting applying anti-mouse syndecan-1 monoclonal antibody. Cells were sorted to obtain homogenous cell populations exhibiting high levels of syndecan expression. Sorted cells were subjected to FACS analyses (c) and immunofluorescent staining (d) applying anti-mouse syndecan-1 monoclonal antibody. Note high expression of all syndecan-1 variants and their localization on the cell membrane
Fig. 2
Fig. 2
Heparanase uptake. a Heparanase binding. Heparanase (1 μg/ml) was added to 293 cells over-expressing syndecan-1 variants for 1 h on ice. Cells were then washed twice with cold PBS and subjected to FACS analyses applying anti-Myc Tag antibody. Corresponding cell lysates were subjected to immunoblotting with anti-heparanase (b, upper panel) and anti-actin (b, lower panel) antibodies. c, d Heparanase processing. Heparanase or heparanase-2 (1 μg/ml) were added to 293 cells over-expressing syndecan-1 variants for 1 h at 37 °C. Cells were then washed twice with PBS and lysate samples were subjected to immunoblotting applying anti-heparanase (Hepa; upper and middle panels) and anti-heparanase-2 (Hpa2, lower panel) antibodies. The heparanase blot is shown at short (upper panel) and longer (middle panel) exposures depicting the latent (65-kDa) and processed (50-kDa) forms of heparanase. Densitometry quantification of the 50-kDa processed heparanase following uptake in five independent experiments is shown graphically in d. Note increased heparanase processing by cells over-expressing wild-type or C1 variant of syndecan, but reduced processing following over-expression of syndecan-1 deleted for the entire cytoplasmic tail (Del), the V region or C2 domain. *p = 0.0009 and 0.01 for Mock vs. WT and Mock vs. C1, respectively; **p = 0.001, 0.0006, and 0.0004 for WT vs. C2, WT vs. V, and WT vs. Delta, respectively; ***p = 0.0005 for Mock vs. Delta. e Heparanase enzymatic activity following heparanase addition to control (Mock) transfected cells, or cells over-expressing wild-type (WT) or the C2 variant of syndecan 1
Fig. 3
Fig. 3
a Immunofluorescent staining. Heparanase (1 μg/ml) was added to U87 glioma cells over-expressing syndecan-1 variants for 1 h at 37 °C. Cells were then fixed with cold methanol and subjected to immunofluorescent staining applying anti-heparanase mouse monoclonal antibody (middle panels, green). Merged images with rat anti-syndecan staining (lower panels, red) are shown in the upper panels. Note retention of heparanase at the cell membrane, co-localizing with syndecan lacking the entire cytoplasmic tail (Delta), the V region or C2 domain and increased heparanase-positive endocytic vesicles in cells over-expressing wild-type (WT) or C1 variants of syndecan-1. Quantification of heparanase-positive (green) peri-nuclear endocytic vesicles is shown graphically in (b) as average of at least 12 representative cells. *p = 1.8 × 10−8 for Mock vs. WT; **p = 0.001, 0.95 × 10−8, and 1.3 × 10−6 for WT vs. Delta, WT vs. V and WT vs. C2, respectively. c MDA-MB-231 breast carcinoma cells. Heparanase (1 μg/ml) was added to MDA-MB-231cells over-expressing wild-type syndecan-1 (WT), or control mock transfected cells for 1 h at 37 °C. Cells were then fixed and subjected to immunofluorescent staining applying anti-heparanase (green; middle panels) and anti-syndecan-1 (lower panels, red) antibodies. Merged images are shown in the upper panels. Note co-localization of heparanase and syndecan in endocytic vesicles but not on the cell membrane. d Heparanase was similarly added to parental MDA-MB-231 cells expressing endogenous levels of syndecan-1 for 1 h; cells were fixed with methanol and subjected to immunofluorescent staining applying anti-LAMP1, a lysosomal marker (middle panels, red) and anti-syndecan-1 (lower panels, green) antibodies. Merged images are shown in the upper panels. Note co-localization of syndecan-1 with LAMP1
Fig. 4
Fig. 4
Heparanase uptake is not mediated by cortactin. a Immunostaining. Heparanase (1 μg/ml) was added to parental U87 cells expressing endogenous levels of syndecan-1 for 2 h at 37 °C. Cells were then fixed in cold methanol and double stained for heparanase (left middle panel, red) or syndecan-1 (right middle panel, red) and cortactin (upper panels, green). Merged images are shown in the lower panels. Note co-localization of cortactin and heparanase or syndecan-1 in endocytic vesicles. b Immunoblotting. 293 cells were transfected with anti-cortactin (Cort) or control (Con) siRNA. Three days thereafter, heparanase (1 μg/ml) was added for 2 h at 37 °C and lysate samples were subjected to immunoblotting applying anti-cortactin (upper panel) and anti-heparanase (second panel) antibodies. c Heparanase (1 μg/ml) was similarly added to U87 cells for 2 h at 37 °C. Cells were then fixed and double stained with anti-heparanase (middle panels, red) and anti-Rab9 (left upper panel, green) or anti-Rab7 (right upper panel, green) antibodies
Fig. 5
Fig. 5
Heparanase uptake is mediated by syntenin and α-actinin. a Immunoblotting. 293 cells were transfected with siRNA oligonucleotides against the gene indicated or control siRNA. After 3 days, heparanase (1 μg/ml) was added at 37 °C for 2 h and cell lysates were subjected to immunoblotting applying anti-heparanase (upper panel) or anti-actin (second panel) antibodies. Densitometry analysis of the 50-kDa processed heparanase band in five independent experiments is shown graphically in the lower panel. Gene silencing of syntenin (Synt) and α-actinin (α-act) resulted in a 2.5-fold decrease in heparanase processing (p = 0.0002 and p = 0.001 for siCon vs. siSyntenin and siCon vs. siα-actinin, respectively). b, c 293 cells were similarly transfected with anti-syntenin (b) or anti-α-actinin (c) siRNAs and lysate samples were subjected to immunoblotting applying anti- syntenin (b, upper panel), anti-α-actinin (c, upper panel), and anti-actin (lower panels) antibodies. Attenuation of heparanase processing (a) correlates with a comparable decrease of syntenin and α-actinin expression levels (p = 0.0004 and p = 0.0002 for siCon vs. siSyntenin and siCon vs. siα-actinin, respectively; b, c, lower panels)
Fig. 6
Fig. 6
a α-actinin immunostaining. U87 glioma cells were subjected to immunofluorescent staining applying anti-syndecan-1 (Synd; upper left panel, red) and anti-α-actinin (upper right panel, green) antibodies. A merged image is shown in the lower panel. Note co-localization of α-actinin and syndecan-1 at the cell membrane. b Heparanase immunostaining. U87 cells were transfected with the indicated siRNA oligonucleotides. Heparanase (1 μg/ml) was added 3 days later for 2 h at 37 °C. Cells were fixed with cold methanol and subjected to immunofluorescent staining applying anti-heparanase monoclonal antibody. The intensity and scattering (i.e., distribution of the vesicles within the cell) of heparanase-positive endocytic vesicles were quantified and presented graphically in panels c and d, respectively. Heparanase-positive endocytic vesicles are significantly decreased following α-actinin and syntenin gene silencing (p = 0.0002 and p = 0.0001 for siCon vs. siα-actinin and siCon vs. siSyntenin, respectively; c). α-actinin silencing is also associated with more diffused (scattered) heparanase-positive vesicles (arrows) compared with peri-nuclear accumulation in control cells (p = 1 × 10−5) (d)

References

    1. Dempsey LA, Brunn GJ, Platt JL. Heparanase, a potential regulator of cell-matrix interactions. Trends Biochem Sci. 2000;25:349–351. doi: 10.1016/S0968-0004(00)01619-4. - DOI - PubMed
    1. Parish CR, Freeman C, Hulett MD. Heparanase: a key enzyme involved in cell invasion. Biochim Biophys Acta. 2001;1471:M99–M108. - PubMed
    1. Vlodavsky I, Friedmann Y. Molecular properties and involvement of heparanase in cancer metastasis and angiogenesis. J Clin Invest. 2001;108(3):341–347. doi: 10.1172/JCI13662. - DOI - PMC - PubMed
    1. Gingis-Velitski S, Zetser A, Kaplan V, Ben-Zaken O, Cohen E, Levy-Adam F, Bashenko Y, Flugelman MY, Vlodavsky I, Ilan N. Heparanase uptake is mediated by cell membrane heparan sulfate proteoglycans. J Biol Chem. 2004;279:44084–44092. doi: 10.1074/jbc.M402131200. - DOI - PubMed
    1. Gingis-Velitski S, Zetser A, Flugelman MY, Vlodavsky I, Ilan N. Heparanase induces endothelial cell migration via protein kinase B/Akt activation. J Biol Chem. 2004;279:23536–23541. doi: 10.1074/jbc.M400554200. - DOI - PubMed

Publication types

LinkOut - more resources