. 2014 May 15;28(10):1085-100.
doi: 10.1101/gad.235515.113. Epub 2014 May 1.

Glioma cancer stem cells secrete Gremlin1 to promote their maintenance within the tumor hierarchy

Affiliations

Glioma cancer stem cells secrete Gremlin1 to promote their maintenance within the tumor hierarchy

Kenneth Yan et al. Genes Dev. .

Abstract

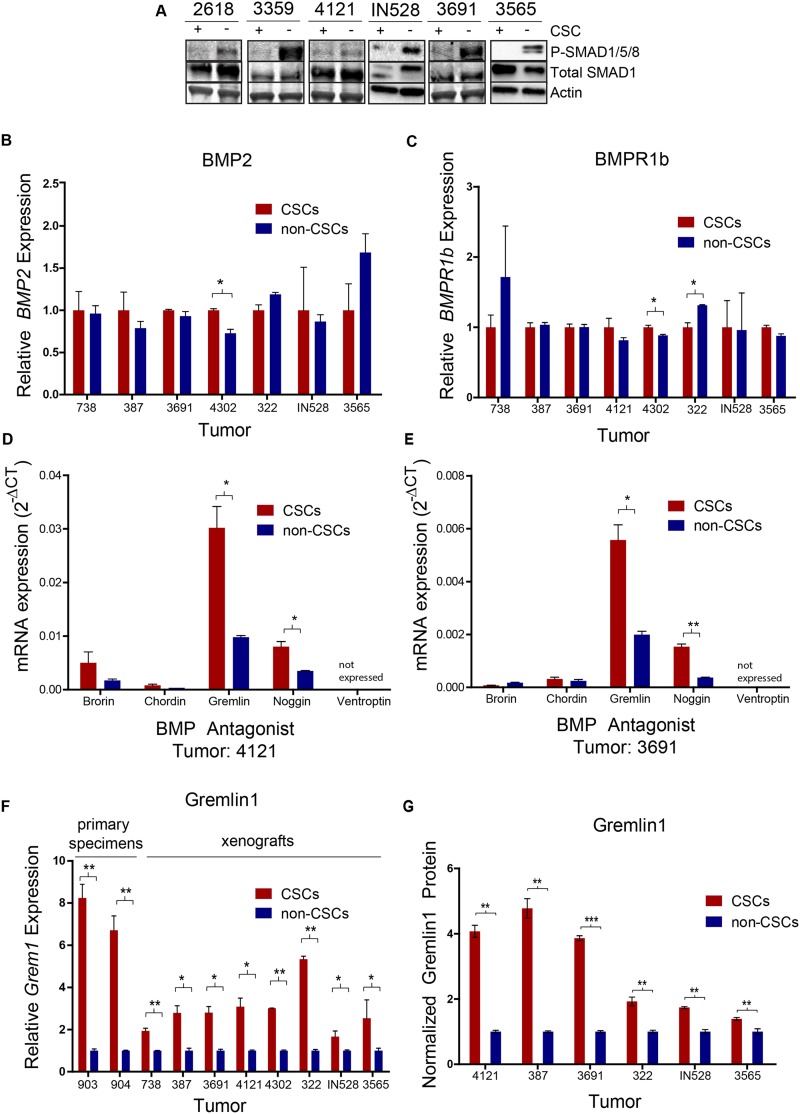
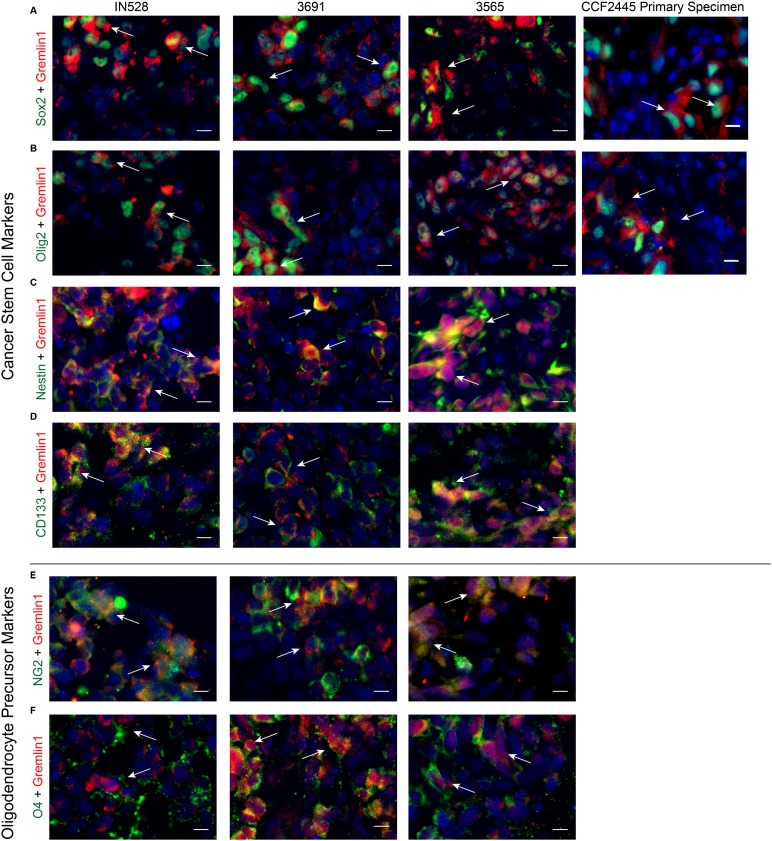
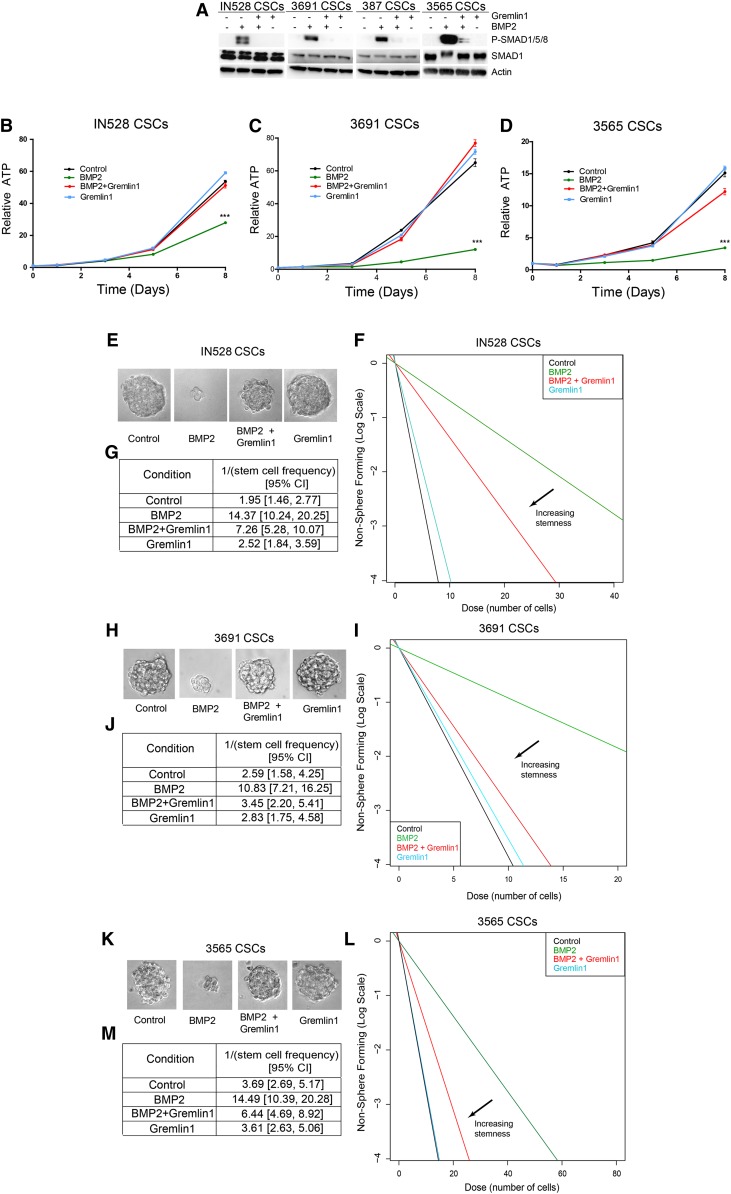
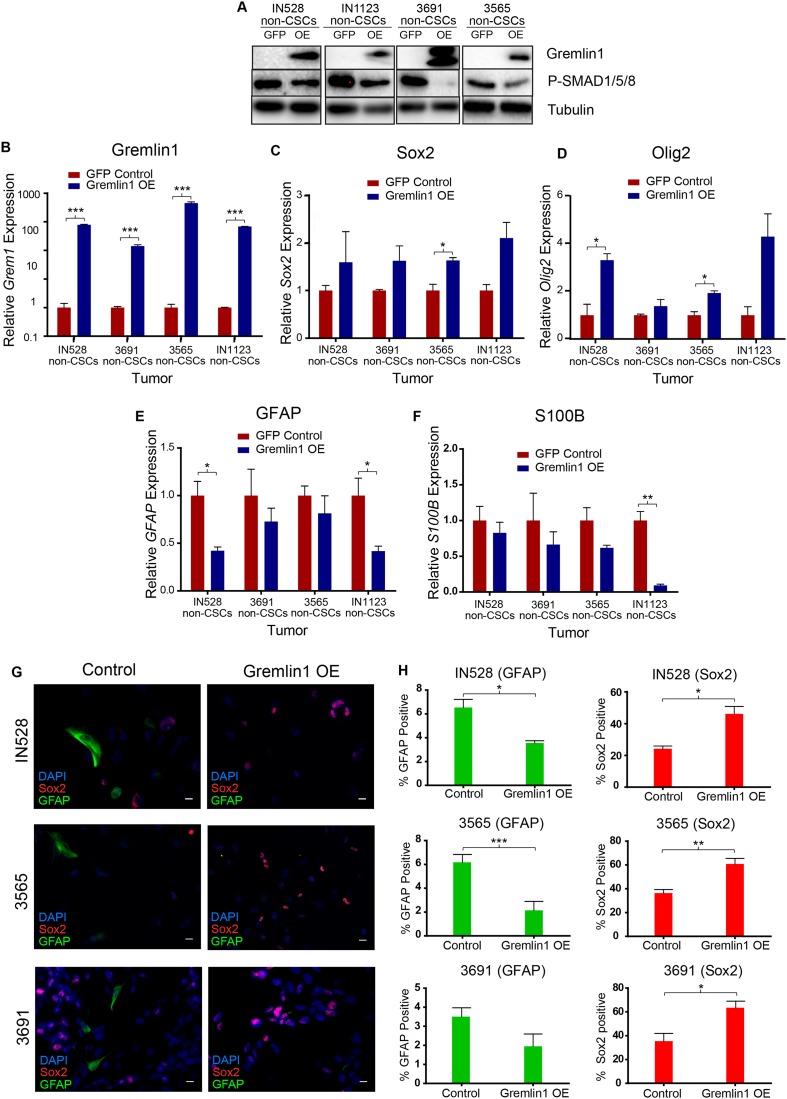
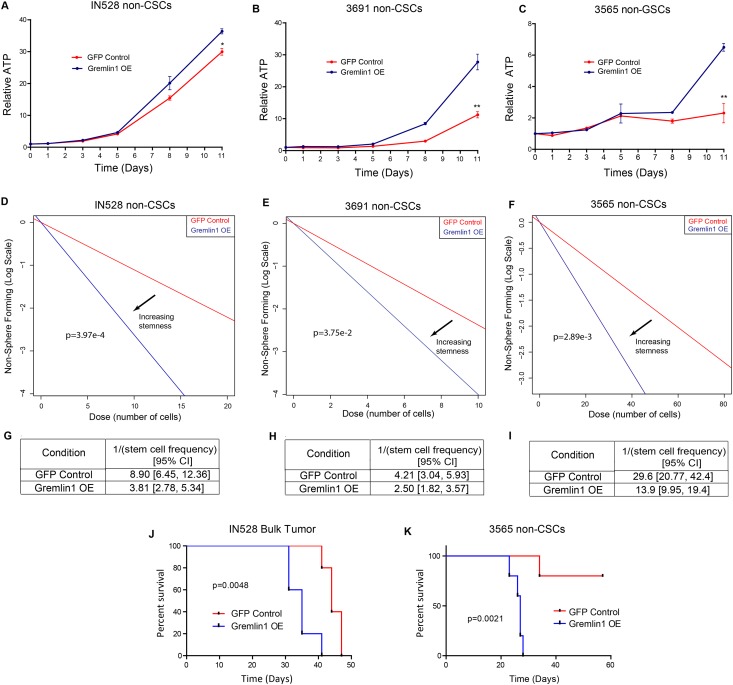
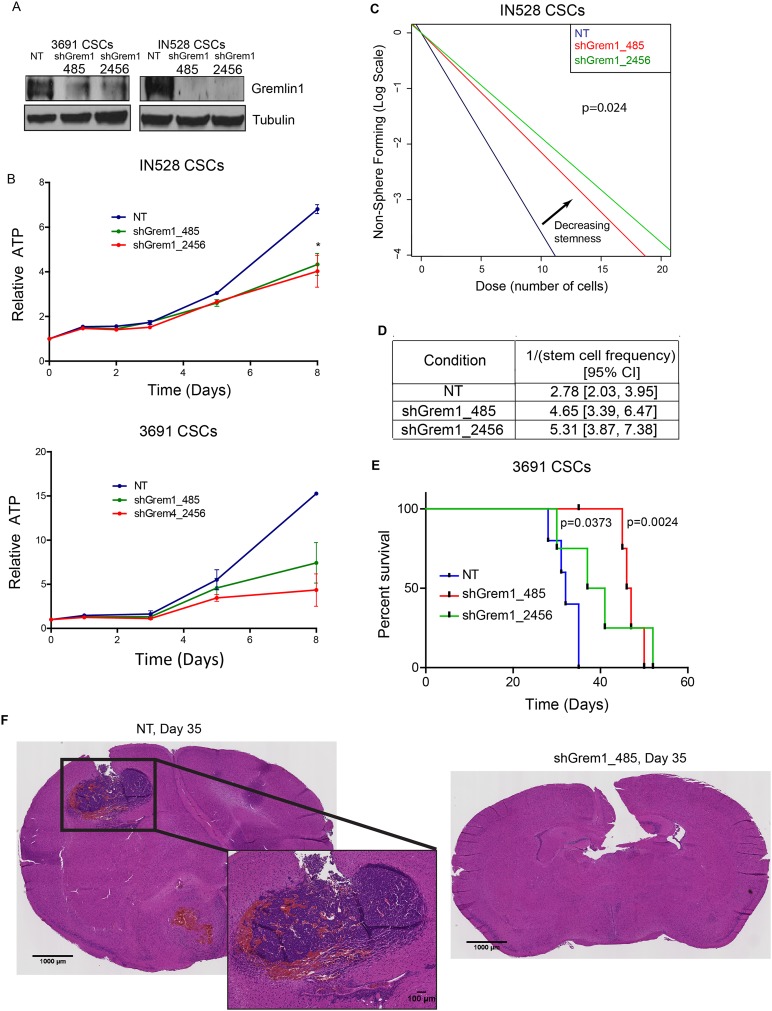
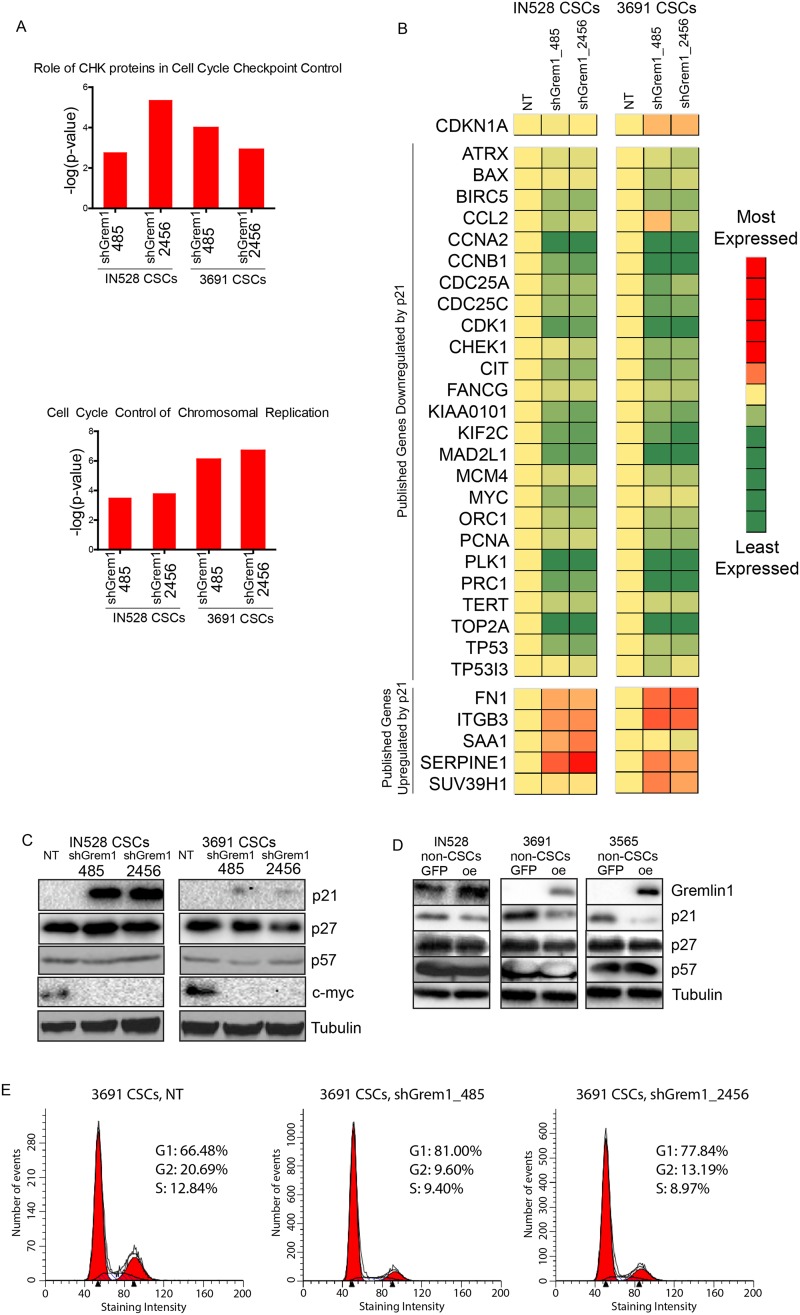
Glioblastomas are the most prevalent and lethal primary brain tumor and are comprised of hierarchies with self-renewing cancer stem cells (CSCs) at the apex. Like neural stem cells (NSCs), CSCs reside in functional niches that provide essential cues to maintain the cellular hierarchy. Bone morphogenetic proteins (BMPs) instruct NSCs to adopt an astrocyte fate and are proposed as anti-CSC therapies to induce differentiation, but, paradoxically, tumors express high levels of BMPs. Here we demonstrate that the BMP antagonist Gremlin1 is specifically expressed by CSCs as protection from endogenous BMPs. Gremlin1 colocalizes with CSCs in vitro and in vivo. Furthermore, Gremlin1 blocks prodifferentiation effects of BMPs, and overexpression of Gremlin1 in non-CSCs decreases their endogenous BMP signaling to promote stem-like features. Consequently, Gremlin1-overexpressing cells display increased growth and tumor formation abilities. Targeting Gremlin1 in CSCs results in impaired growth and self-renewal. Transcriptional profiling demonstrated that Gremlin1 effects were associated with inhibition of p21(WAF1/CIP1), a key CSC signaling node. This study establishes CSC-derived Gremlin1 as a driving force in maintaining glioblastoma tumor proliferation and glioblastoma hierarchies through the modulation of endogenous prodifferentiation signals.

Keywords: BMP antagonists; Gremlin1; bone morphogenetic proteins (BMPs); cancer stem cells; glioblastoma; stem cell hierarchies.


Figures

Figure 1.
Figure 1.
Glioma CSCs secrete Gremlin1 to inhibit BMP signaling. (A) Immunoblot of SMAD1/5/8 phosphorylation in matched CSC/nonstem glioma cell populations. RT–PCR expression data of BMP2 (B) and BMPR1b (C) in matched CSC/nonstem glioma cell populations. (D,E) RT–PCR expression data of a panel of BMP antagonists in CSC/nonstem glioma cell populations. (F) RT–PCR expression data of Grem1 in CSC/nonstem glioma cell populations. (G) ELISA protein expression data of Gremlin1 in matched CSC/nonstem glioma cell populations. (*) P < 0.05; (**) P < 0.01; (***) P < 0.001.
Figure 2.
Figure 2.
Gremlin1 colocalizes with stem cell markers in glioblastoma. Immunofluorescent staining for Gremlin1 in three patient-derived xenografts and a primary human specimen with CSC markers Sox2 (A), Olig2 (B), Nestin (C), and CD133 (D) and oligodendrocyte precursor markers NG2 (E) and O4 (F). White arrows indicate colocalization. Bar, 10 µm.
Figure 3.
Figure 3.
Exogenous Gremlin1 can block BMP2-mediated growth inhibition and depletion of self-renewal. (A) Immunoblot of phosphorylated and total Smad proteins following 30 min of BMP2 and/or Gremlin1 treatments. (B–D) Growth curves following BMP2 and/or Gremlin1 treatments. (E,H,K) Representative images of neurospheres in IN528, 3691, and 3565 CSCs following 10 d of BMP2 and/or Gremlin1 treatments. In vitro limiting dilution assays (F,I,L) and quantification (G,J,M) following 10 d of BMP2 and/or Gremlin1 treatments. (***) P < 0.001.
Figure 4.
Figure 4.
Gremlin1 expression blocks endogenous BMP2 signaling and differentiation. (A) Immunoblot of Gremlin1 and P-SMAD1/5/8 in GFP versus Gremlin1-overexpressing cells in four nonstem glioma cell-enriched models. (BF) RT–PCR for Grem1 (B), Sox2 (C), Olig2 (D), GFAP (E), and S100B (F) expression following Gremlin1 overexpression. (G) Staining for Sox2 and GFAP following Gremlin1 overexpression. (H) Quantification of staining in G. (*) P < 0.05; (**) P < 0.01; (***) P < 0.001. Bar, 10µm.
Figure 5.
Figure 5.
Gremlin1 expression promotes proliferation and tumor growth by nonstem glioma cells. (A–C) Growth curves following Gremlin1 overexpression in IN528, 3691, and 3565 nonstem glioma cells. (D–F) In vitro limiting dilution assay following 10 d of Gremlin1 overexpression in IN528, 3691, and 3565 nonstem glioma cells. (G–I) Quantification of data in DF. (J) Kaplan-Meier survival curve for immunocompromised mice injected intracranially with GFP or Gremlin1-overexpressing bulk IN528 tumor cells. (K) Kaplan-Meier survival curve for immunocompromised mice injected intracranially with GFP or Gremlin1-overexpressing 3565 nonstem glioma cells. (*) P < 0.05; (**) P < 0.01.
Figure 6.
Figure 6.
Gremlin1 knockdown inhibits CSC proliferation and tumor growth. (A) Immunoblot of Gremlin1 following infection with a nontargeting control shRNA (NT) or shRNAs directed against Gremlin1 (485 and 2456) in two CSC models. (B) Growth curves following Gremlin1 knockdown in IN528 and 3691 CSCs. (C) In vitro limiting dilution assay following 10 d of Gremlin1 knockdown in IN528 CSCs. (D) Quantification of data in C. (E) Kaplan-Meier survival curves for immunocompromised mice injected intracranially with a vector containing a nontargeting sequence control (NT) shRNA or Gremlin1 shRNA-infected 3691 CSCs. (F) H&E staining of brains injected with 3691 CSCs expressing an NT shRNA or Gremlin1 shRNA-infected cells. (*) P < 0.05.
Figure 7.
Figure 7.
Gremlin1 promotes cell cycle progression in CSCs via p21. (A) Ingenuity pathway analysis of pathways up-regulated by Gremlin1 shRNA-derived gene expression data. (B) Heat map of gene expression changes following Gremlin1 shRNA knockdown in genes previously characterized in the literature as up-regulated or down-regulated by p21; red is higher expression, and green is lower expression. (C) Western blot of Gremlin1 knockdown in two CSC models for p21, p27, p57, c-Myc, and Gremlin1. (D) Western blot of Gremlin1 overexpression in three CSC models for Gremlin1, p21, p27, and p57. (E) Cell cycle analysis following Gremlin1 shRNA knockdown in 3691 CSCs.

Comment in

References

    1. Abbas T, Dutta A 2009. p21 in cancer: intricate networks and multiple activities. Nat Rev Cancer 9: 400–414 - PMC - PubMed
    1. Aboody KS, Brown A, Rainov NG, Bower KA, Liu S, Yang W, Small JE, Herrlinger U, Ourednik V, Black PM, et al. 2000. Neural stem cells display extensive tropism for pathology in adult brain: evidence from intracranial gliomas. Proc Natl Acad Sci 97: 12846–12851 - PMC - PubMed
    1. Ades L, Guerci A, Raffoux E, Sanz M, Chevallier P, Lapusan S, Recher C, Thomas X, Rayon C, Castaigne S, et al. 2010. Very long-term outcome of acute promyelocytic leukemia after treatment with all-trans retinoic acid and chemotherapy: the European APL Group experience. Blood 115: 1690–1696 - PubMed
    1. Anido J, Saez-Borderias A, Gonzalez-Junca A, Rodon L, Folch G, Carmona MA, Prieto-Sanchez RM, Barba I, Martinez-Saez E, Prudkin L, et al. 2010. TGF-β receptor inhibitors target the CD44(high)/Id1(high) glioma-initiating cell population in human glioblastoma. Cancer Cell 18: 655–668 - PubMed
    1. Bao S, Wu Q, McLendon RE, Hao Y, Shi Q, Hjelmeland AB, Dewhirst MW, Bigner DD, Rich JN 2006a. Glioma stem cells promote radioresistance by preferential activation of the DNA damage response. Nature 444: 756–760 - PubMed

Publication types

MeSH terms

Substances