. 2014 May 15;28(10):1054-67.
doi: 10.1101/gad.239681.114. Epub 2014 May 1.

Global microRNA depletion suppresses tumor angiogenesis

Affiliations

Global microRNA depletion suppresses tumor angiogenesis

Sidi Chen et al. Genes Dev. .

Abstract

MicroRNAs delicately regulate the balance of angiogenesis. Here we show that depletion of all microRNAs suppresses tumor angiogenesis. We generated microRNA-deficient tumors by knocking out Dicer1. These tumors are highly hypoxic but poorly vascularized, suggestive of deficient angiogenesis signaling. Expression profiling revealed that angiogenesis genes were significantly down-regulated as a result of the microRNA deficiency. Factor inhibiting hypoxia-inducible factor 1 (HIF-1), FIH1, is derepressed under these conditions and suppresses HIF transcription. Knocking out FIH1 using CRISPR/Cas9-mediated genome engineering reversed the phenotypes of microRNA-deficient cells in HIF transcriptional activity, VEGF production, tumor hypoxia, and tumor angiogenesis. Using multiplexed CRISPR/Cas9, we deleted regions in FIH1 3' untranslated regions (UTRs) that contain microRNA-binding sites, which derepresses FIH1 protein and represses hypoxia response. These data suggest that microRNAs promote tumor responses to hypoxia and angiogenesis by repressing FIH1.

Keywords: CRISPR/Cas9; Dicer; angiogenesis; gene regulation; hypoxia; microRNA.


Figures

Figure 1.
Figure 1.
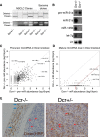
(A) Genotyping of Dicer1 heterozygous and knockout NSCLC clonal cell lines using capillary electrophoresis (top panel) and standard gel electrophoresis (bottom panel) showing loss of the wild-type (floxed) Dicer1 allele in Dicer1 knockout cells. Sarcoma clones with known Dicer1 genotypes were used as a reference. (Note that lane 2 is left blank.) (B) Northern blot of several representative microRNAs in Dicer1+/− and knockout cells showing loss of mature microRNAs in Dicer1 knockout cells. (C) Scatter plot of pre-microRNA abundance from microRNA-seq in Dicer1 heterozygous and knockout cells. The gray dotted line represents the diagonal (x = y). (D) Scatter plot of mature microRNA abundance from microRNA-seq in Dicer1 heterozygous and knockout cells showing global loss of mature microRNAs in Dicer1 knockout cells. The gray dotted line represents the diagonal (x = y); the red dotted line represents the 100-fold decrease (x = y/100). (E) Immunohistochemistry (IHC) of Dicer in sections of tumors induced by Dicer1−/− and Dicer1+/− cells showing loss of Dicer protein staining in Dicer1 knockout tumors. Images were captured by a light microscope under 20× magnification. Bar, 100 μm. (HRP) Horseradish peroxidase. Red arrowheads indicate representative tumor cells. Blue arrows indicate representative peritumor host cells in Dicer1−/− tumors.
Figure 2.
Figure 2.
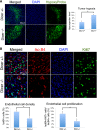
(A) IF of sections of tumors induced by Dicer1+/− and Dicer1−/− cells showing increased level of hypoxia in Dicer1−/− tumors. Channels are DAPI (blue) and Hypoxyprobe (green). Images were captured by a confocal microscope under 20× magnification. Bar, 50 μm. The right panel shows the quantification of tumor hypoxia level indicated by Hypoxyprobe staining sum intensity normalized by nuclei (DAPI). (B) IF of sections of tumors induced by Dicer1+/− and Dicer1−/− cells showing decreased level of vasculature in Dicer1−/− tumors. Channels are DAPI (blue) and antibodies against Isolectin B4 (Iso.B4; red) and Ki67 (green). Images were captured by a confocal microscope under 40× magnification. Bar, 20 μm. The bottom left panel shows quantification of vasculature indicated by Isolectin B4+ cells (percentage). The bottom right panel shows quantification of the levels of EC proliferation indicated by Ki67+Isolectin B4+ double-positive ECs normalized by total Isolectin B4+ ECs (percentage). Quantification was performed blind on three randomly chosen fields using CellProfiler. Data represent the average from three samples ± standard error of the mean (SEM). The asterisk denotes statistical significance (t-test, P < 0.01).
Figure 3.
Figure 3.
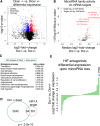
(A) Scatter plot of expressed coding mRNA genes in Dicer1+/− and Dicer1−/− NSCLC cells showing global differential expression between two genotypes. The X-axis is the log2 fold change of Dicer1 knockout over heterozygotes, and the Y-axis is the statistical significance (−log10 P-value). Genes significantly up-regulated are shown as red dots. Genes significantly down-regulated are shown as blue dots. Genes not significantly changed are shown as black dots. (B) Global microRNA activity in the transcriptome of mRNAs in NSCLC cells depicted as a scatter plot of derepression of TargetScan-predicted conserved target gene sets of microRNAs grouped by TargetScan seed family. The X-axis is the median log2 fold change of microRNA target genes versus randomized control gene sets, and the Y-axis is the statistical significance (−log10 P-value). MicroRNA families with significant activity in target gene set repression are shown as red dots. (C) Gene ontology (GO) analysis of genes significantly down-regulated in Dicer1 knockout showing enrichment in functional clusters of angiogenesis. (D) A Venn diagram of gene set overlap between genes significantly down-regulated in Dicer1−/− and target genes of HIF1α (HIF1A target). The target gene set of HIF1α was retrieved from the Ingenuity Pathway Analysis (IPA) database. (E) A waterfall plot of differential expression of known HIF antagonist genes between Dicer1 knockout and heterozygotes showing that the top up-regulated gene is FIH1.
Figure 4.
Figure 4.
(A) Schematic representation of FIH1 targeting using the CRISPR/Cas9 system. (Top panel) Gene structure model of FIH1 in mouse chromosome 19 (not drawn to scale). (Bottom panel) sgRNA sequence and targeted region sequence. The start codon (ATG) and the PAM (CGG) are indicated. (B) Western blot of FIH protein from clonal cell lines after sg-FIH1 and Cas9 transfection showing loss of FIH1 protein expression in seven out of 12 cell lines. (C) Miseq of the FIH1 exon1 genomic PCRs of clonal cell lines in a Dicer1−/− background.
Figure 5.
Figure 5.
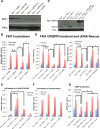
(A) Western blot of FIH1 protein following siRNA or microRNA transfection showing transfection of FIH1 targeting siRNA- or microRNA-reduced FIH1 protein in Dicer1 knockout cells to a level similar to Dicer1 heterozygous. (B) HRE reporter assay of Dicer1+/− and Dicer1−/− cells showing that Dicer1 knockout cells reduced HRE activity compared with Dicer1 heterozygotes and that FIH1 knockdown increased HRE activity only in a Dicer1 knockout background. (C) Western blot of FIH1 protein with FIH1 knockout and rescue showing loss of FIH1 protein in CRISPR/Cas9-generated FIH1 knockout cell lines and re-expression after transfection of a plasmid with human FIH1 cDNA. (D) HRE assay of FIH1 knockout and rescue showing increase of HIF transcription activity upon FIH1 knockout only in Dicer1 knockout background, and suppression of HRE by re-expressing FIH1. (E) HRE assay of microRNA addback in Dicer1 knockout FIH1 wild-type cells showing significant increase of HIF transcription activity upon transfection of FIH1 targeting microRNAs (let-7 and miR-125). (F) HRE assay of microRNA addback in Dicer1;FIH1 double-knockout cells showing diminished effects of microRNA addback on HIF transcription activity. For HRE assays in B and DF, the raw measurements were normalized to the value of control group hypoxia conditions. (G) VEGF ELISA assay showing reduced VEGF production in Dicer1 knockout cells compared with Dicer1 heterozygotes. VEGF production increased upon FIH1 knockout in the Dicer1 knockout background to a level similar to Dicer1+/−;FIH1+/+. (pg/ng t.p) Picograms of VEGF per nanogram of total protein. Data represent the average from three samples ± SEM. The asterisk denotes statistical significance (t-test, P < 0.01). (n.s.) Not significant.
Figure 6.
Figure 6.
(A) IF of sections of tumors induced by Dicer1 heterozygous, Dicer1 knockout, and Dicer1;FIH1 double-knockout cells. Channels are Hoechst (blue), Hypoxyprobe (green), and Isolectin B4 (Iso.B4, red). Images were captured by a confocal microscope under 20× magnification with 0.5× digital zoom. Bar, 50 μm. (B) Quantification of the levels of hypoxia intensity indicated by relative Hypoxyprobe staining intensity. Quantification was performed blind on three randomly chosen fields using CellProfiler. (C) Quantification of vasculature density indicated by relative Isolectin B4+ cells (percentage). Quantification was performed blind on three randomly chosen fields using CellProfiler. Data represent mean ± SEM. The asterisk denotes statistical significance (t-test, P < 0.01).
Figure 7.
Figure 7.
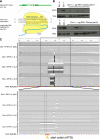
(A) Sanger sequencing of genomic PCR of a clonal FIH1 3′ UTR mutant cell line harboring a homozygous 3.7-kb deletion generated using CRISPR/Cas9. (B) Captured Illumina sequencing of the FIH1 3′ UTR of the mutant cell line harboring a homozygous 3.7-kb deletion. (C) HRE assay of representative FIH1 3′ UTR mutant cell lines showing repressed HIF transcription activity. Data represent mean ± SEM. The asterisk denotes statistical significance (t-test, P < 0.01). (n.s.) Not significant.

Comment in

  • Hypoxia: micro changes.
    McCarthy N. McCarthy N. Nat Rev Cancer. 2014 Jun;14(6):382-3. doi: 10.1038/nrc3754. Epub 2014 May 15. Nat Rev Cancer. 2014. PMID: 24827507 No abstract available.

References

    1. Ambros V, Bartel B, Bartel DP, Burge CB, Carrington JC, Chen X, Dreyfuss G, Eddy SR, Griffiths-Jones S, Marshall M, et al. 2003. A uniform system for microRNA annotation. RNA 9: 277–279 - PMC - PubMed
    1. Bartel DP 2009. MicroRNAs: target recognition and regulatory functions. Cell 136: 215–233 - PMC - PubMed
    1. Bernstein E, Kim SY, Carmell MA, Murchison EP, Alcorn H, Li MZ, Mills AA, Elledge SJ, Anderson KV, Hannon GJ 2003. Dicer is essential for mouse development. Nat Genet 35: 215–217 - PubMed
    1. Brunet A, Bonni A, Zigmond MJ, Lin MZ, Juo P, Hu LS, Anderson MJ, Arden KC, Blenis J, Greenberg ME 1999. Akt promotes cell survival by phosphorylating and inhibiting a Forkhead transcription factor. Cell 96: 857–868 - PubMed
    1. Calin GA, Croce CM 2006. MicroRNA–cancer connection: the beginning of a new tale. Cancer Res 66: 7390–7394 - PubMed

Publication types

Associated data