. 2014 Jul 1;33(13):1474-91.
doi: 10.1002/embj.201387454. Epub 2014 Apr 30.

c-Src drives intestinal regeneration and transformation

Affiliations

c-Src drives intestinal regeneration and transformation

Julia B Cordero et al. EMBO J. .

Abstract

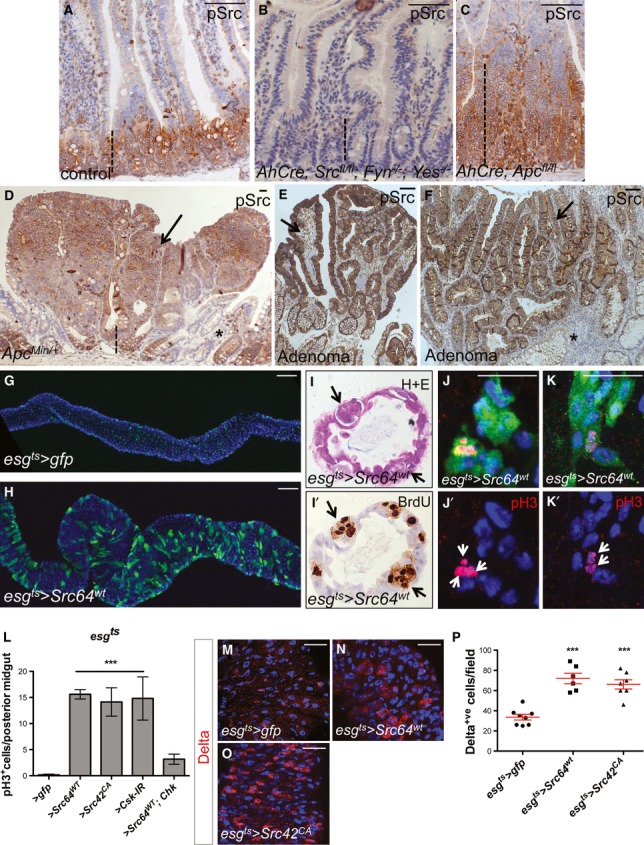
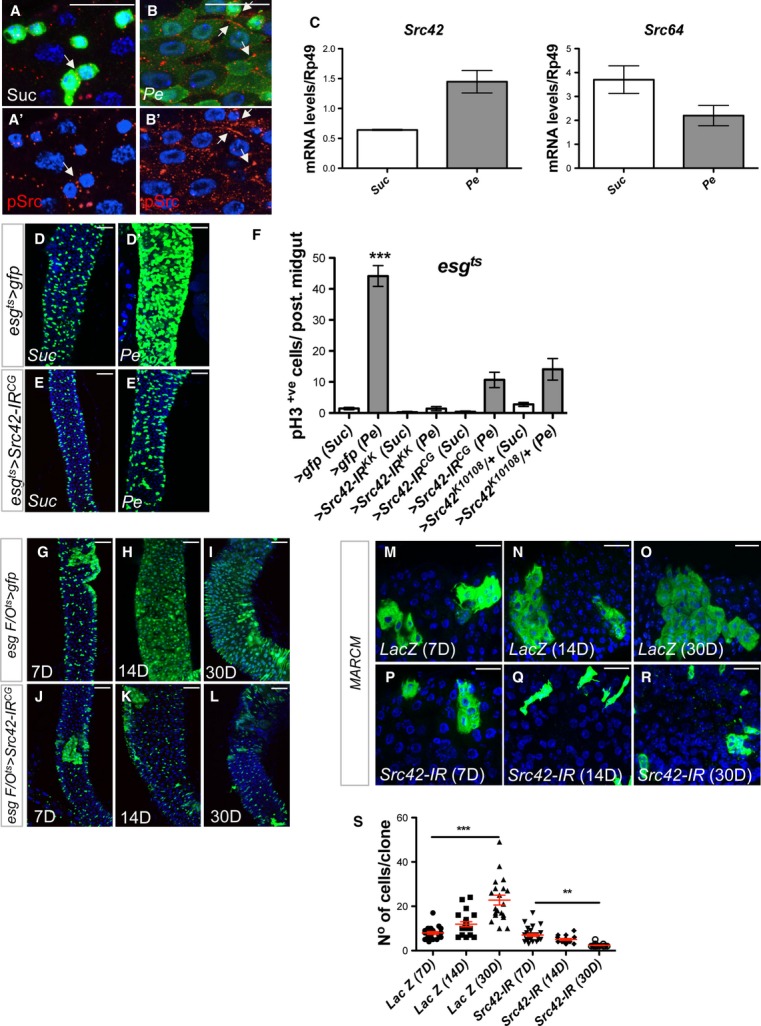
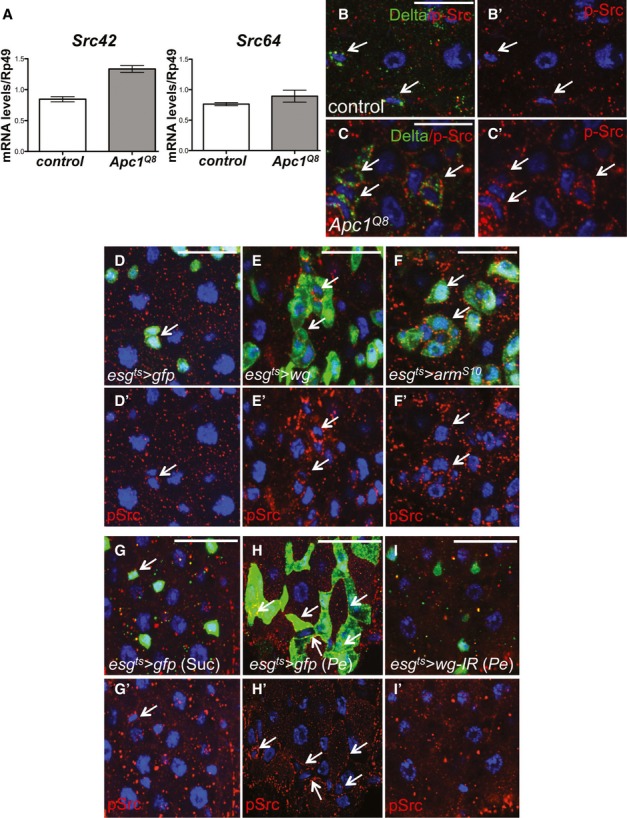
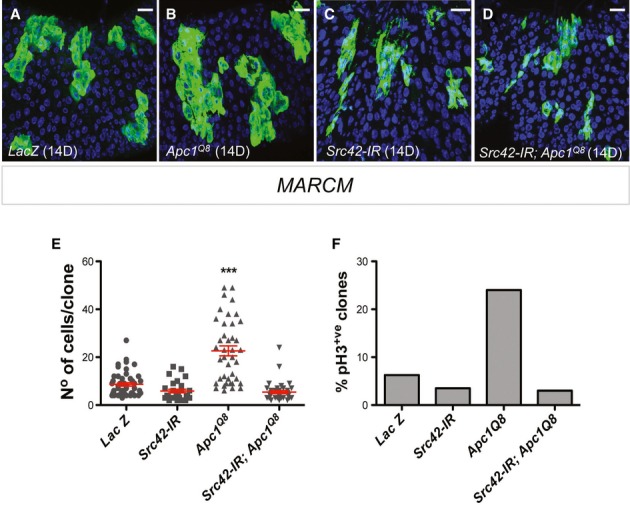
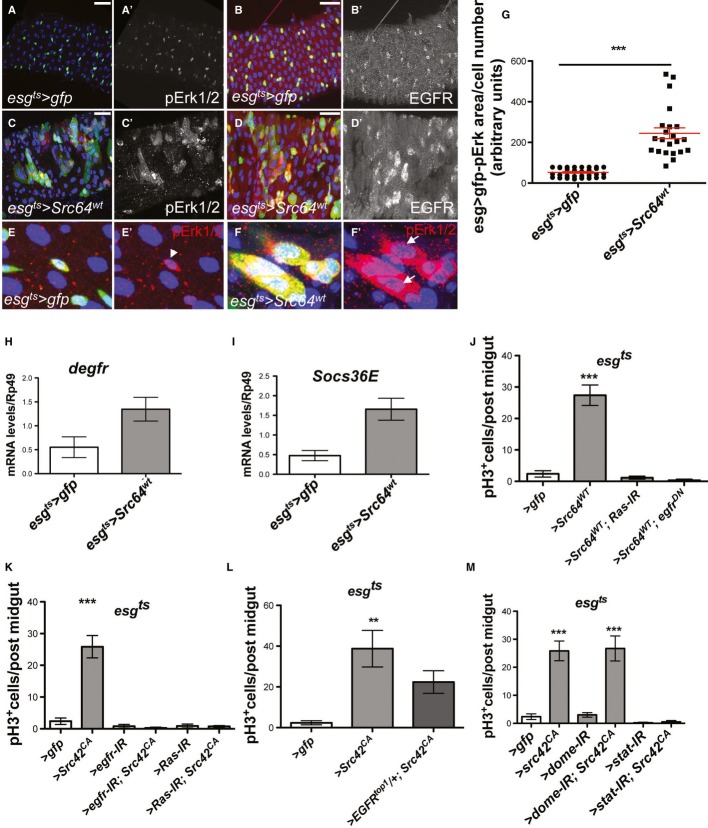
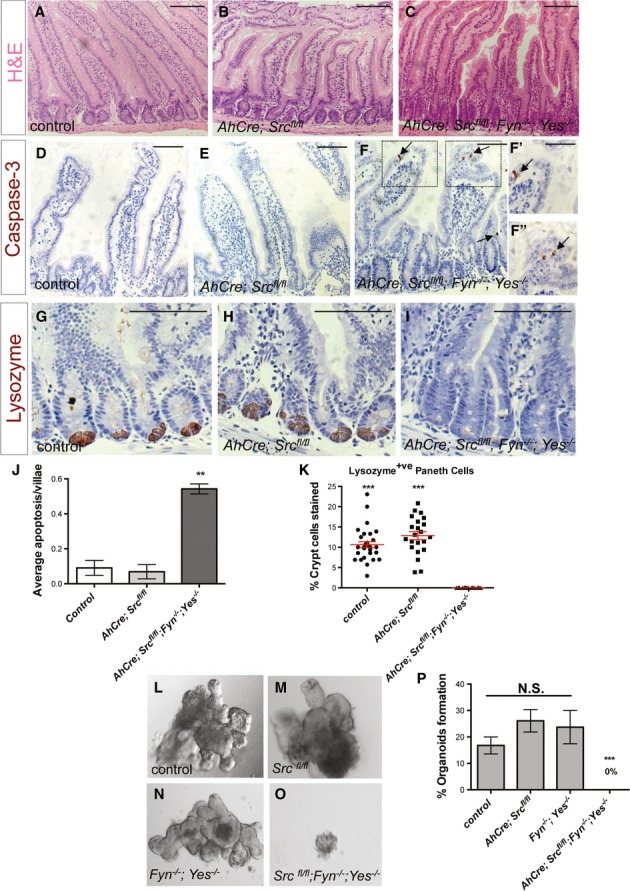
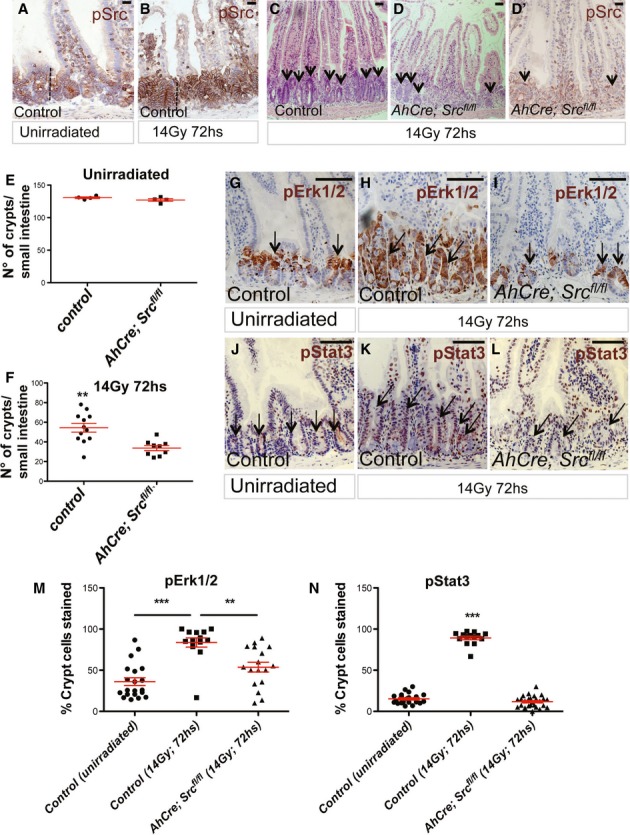
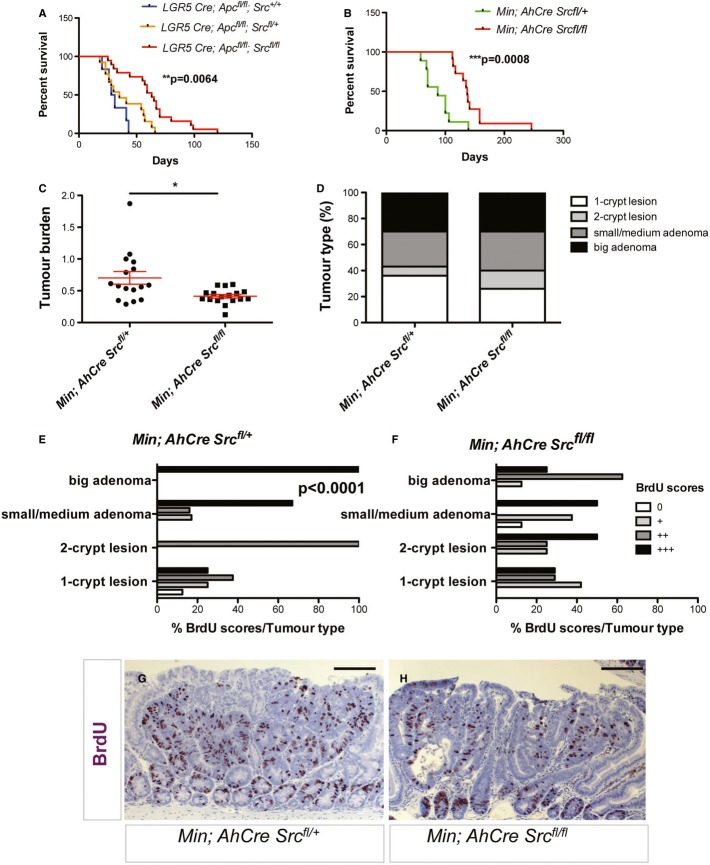
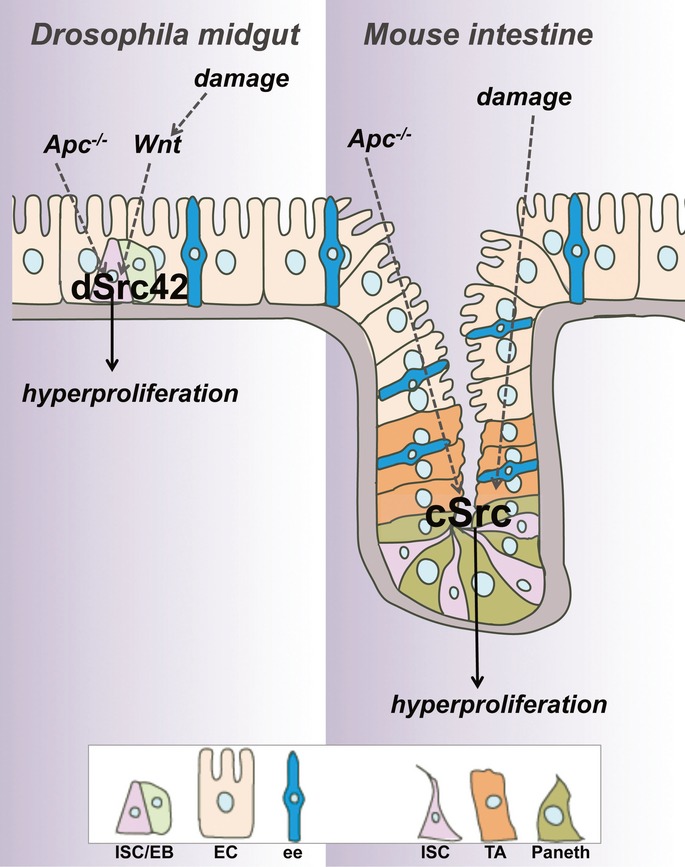
The non-receptor tyrosine kinase c-Src, hereafter referred to as Src, is overexpressed or activated in multiple human malignancies. There has been much speculation about the functional role of Src in colorectal cancer (CRC), with Src amplification and potential activating mutations in up to 20% of the human tumours, although this has never been addressed due to multiple redundant family members. Here, we have used the adult Drosophila and mouse intestinal epithelium as paradigms to define a role for Src during tissue homeostasis, damage-induced regeneration and hyperplasia. Through genetic gain and loss of function experiments, we demonstrate that Src is necessary and sufficient to drive intestinal stem cell (ISC) proliferation during tissue self-renewal, regeneration and tumourigenesis. Surprisingly, Src plays a non-redundant role in the mouse intestine, which cannot be substituted by the other family kinases Fyn and Yes. Mechanistically, we show that Src drives ISC proliferation through upregulation of EGFR and activation of Ras/MAPK and Stat3 signalling. Therefore, we demonstrate a novel essential role for Src in intestinal stem/progenitor cell proliferation and tumourigenesis initiation in vivo.

Keywords: Apc; Src; intestinal stem cells; regeneration; tumourigenesis.


Figures

Figure 1
Figure 1. Src upregulation drives ISC proliferation
A–D Immunohistochemistry to detect the activated form of Src (pSrc) in tissue sections from mouse and human intestines. pSrc is detected in the proliferative ‘crypt’ region (indicated with dashed line) at the base of the mouse small intestinal epithelium in control animals (A). Conditional knockout of Src (Srcfl/fl) combined with full knockout of related kinases Fyn and Yes, resulted in no staining within the intestinal epithelium (B). Intestines with conditional Apc knockout (Apcfl/fl) depict the expected ‘crypt-like’ progenitor phenotype (dashed line) and expansion of the pSrc domain (C). Example of a small intestinal polyp from an ApcMin/+ mouse, showing high p-Src staining within the core of the polyp (arrow), is shown in (D). Note normal tissue around polyp showing pSrc localized at the crypt base (dashed line). Scale bars, 100 μm. E, F pSrc is upregulated within benign human intestinal adenoma lesions (arrows) when compared with normal surrounding tissue (asterisks). Scale bars, 100 μm. G, H Adult Drosophila midguts overexpressing gfp (G; control) or Src (H) for 7 days under the stem/progenitor cell (ISCs/EBs) driver escargot-gal4 (esgts > gfp and esgts > Src64wt, respectively). Unless otherwise noted green marks esg > gfp cells and Dapi (blue) stains all cell nuclei. Scale bars, 100 μm. I, I’ Paraffin-embedded sections from 7-day-old Src-overexpressing midguts (esgts > Src64wt) analysed by Haematoxylin and Eosin H+E (I) and BrdU (I’) staining. Arrows point to ‘polyp-like’ structures containing BrdU+ve cells. J–K’ 7-day-old esgts > Src64wt posterior midguts stained with anti-pH3 (red) to visualize proliferating ISCs (arrows). Scale bars, 20 μm. L ISC proliferation quantified as the number of cells which stained positive for phosphorylated histone 3 (pH3) in posterior midguts from control animals (esgts > gfp) or animals overexpressing Src (esgts > Scr64wt or esgts > Src42CA) or RNA interference for the Src inhibitor Csk (esgts > Csk-IR). Note that co-expression of human ChK (esgts > Scr64wt; Chk) suppresses Src-driven hyperproliferation in the Drosophila midgut. M–O 7-day-old adult posterior midguts from animals of the indicated genotypes stained with anti-Delta (red) to label ISCs. Scale bars, 20 μm. P Quantification of the number of Delta+ve ISCs per field from posterior midguts as in (M-O). Data information: Data in (L) and (P) represent average values ± SEM (***< 0.0001 one-way ANOVA with Bonferroni’s multiple comparison test)
Figure 2
Figure 2. Src is required for ISC proliferation during homeostasis and regeneration of the adult Drosophila midgut
A–B’ Immunofluorescence staining to detect pSrc (red) in midguts from esg > gfp (green) animals after feeding with Sucrose (Suc) (A, A’) or subject to intestinal damage by feeding bacteria (Pe) (B, B’). Arrows point to examples of cell membranes stained with anti-pSrc. Scale bars, 20 µm. C qRT-PCR from whole midguts as in (A–B’) to detect transcript levels of Drosophila Src42 and Src64. Only Src42 was significantly upregulated in damaged midguts. Data represents average values ± SEM. D–E’ Posterior midguts from 14-day-old Suc- or Pe-fed control animals (D, D’ esgts > gfp) or animals subject to RNAi knockdown of Src42 in ISCs/EBs (E, E’ esgts > Src42-IR). F Quantification of ISC proliferation in regenerating posterior midguts from animals of the indicated genotypes and treated as in (D–E’). Data represent average values ± SEM (***< 0.0001 one-way ANOVA with Bonferroni’s multiple comparison test). G–L Homeostatic self-renewal in control and Src42-IR posterior midguts using the escargot ‘flip out’ system (esgts F/O). The lineage from gfp (control) and Src42-IR esg+ve cells (green) was analysed 7, 14 and 30 days after transgene induction. Scale bars, 50 µm. M–R Adult posterior midguts carrying 7-, 14- and 30-day-old MARCM clones (green) from a control transgene (M–O; LacZ) or from Src RNAi (P–R; Src42-IR). Scale bars, 20 µm. S Quantification of the number of cells per clone in posterior midguts as in (M–R). Note that, unlike their control counterparts, MARCM Src42-IR clones failed to grow and even decreased in size over time. Clonal size distribution is presented as a dot plot with the mean clonal size ± SEM (***< 0.0001; **< 0.001 one-way ANOVA with Bonferroni’s multiple comparison test).
Figure 3
Figure 3. Src is activated downstream of Wnt signalling in the adult Drosophila midgut
A qRT-PCR of whole midguts from 7-day-old control and Apc1−/− (Apc1Q8) animals to assess transcript levels of Src42 and Src64. Only Src42 was significantly upregulated in the midgut in response to Apc1 loss. Data represent average values ± SEM. B–C’ 7-day-old control (B, B’) and Apc1Q8 midguts (C, C’) co-stained with anti-pSrc (red) and anti-Delta (green). Apc1Q8 midguts display significant pSrc upregulation within Delta+ve ISCs (arrows). Scale bars, 20 µm. D–F’ pSrc immunofluorescence (red) in 14-day-old midguts from control animals or animals subjected to Wg signalling upregulation by overexpressing Wg or activated β-catenin/Armadillo within ISCs/EBs (esgts > gfp; esgts > wg and esgts > armS10, respectively). Note pSrc upregulation in ISCs/EBs in response to Wg signalling activation (arrows). Scale bars, 20 µm. G–I’ pSrc staining (red) in 14-day-old midguts from control animals or animals subject to wg knockdown by overexpressing a wg RNAi within ISCs/EBs (esgts>wg-IR) and fed with Suc (G, G’) or Pe (H-I’). Note that pSrc upregulation in ISCs/EBs upon Pe feeding (H, H’ arrows) is suppressed by wg knockdown (I, I’). Scale bars, 20 µm.
Figure 4
Figure 4. Src mediates Apc1-dependent intestinal hyperproliferation in the Drosophila midgut
A–D Adult posterior midguts carrying 14-day-old mARCM clones (green) of the indicated genotypes. Scale bars, 20 µm. E, F Quantification of the number of cells per clone (E) and percentage of pH3+ve clones (F) in posterior midguts as in (A–D). Note that Src42 knockdown completely suppressed ISC proliferation in Apc1Q8 MARCM clones (B, D, E, F). Clonal size distribution is presented as a dot plot with the mean clonal size ± SEM (***< 0.0001 one-way ANOVA with Bonferroni’s multiple comparison test).
Figure 5
Figure 5. Src drives ISC hyperproliferation through upregulation of EGFR/MAPK and Stat signalling
A-D’ Immunofluorescence from control (A–B’ esgts > gfp) and Src-overexpressing midguts (C–D’ esgts > Src64WT) stained with anti-pErk1/2 (A, A’, C, C’ red or grey) or anti-EGFR (B, B’, D, D’ red or grey) after 7 days of transgene expression. Src overexpression in ISCs/EBs results in significant upregulation of EGFR and ectopic pErk1/2. Scale bars: 20 µm. E-F’ Magnified views from midguts as in (A, A’, C, C’). Note that, while in control midguts pErk1/2 staining is restricted to small nuclei esg > gfp+ve cells (E, E’ arrowhead), esgts > Src64WT midguts show ectopic pErk1/2 staining in big nuclei esg > gfp+ve cells (F, F’ arrows). G Quantification of the esg > gfp/pErk1/2 cell area in midguts as in (E–F’). Data represent mean values ± SEM (***< 0.0001 unpaired t-test). H, I qRT-PCR from whole midguts of genotypes as in (A–D’) to measure degfr transcript levels (H) and Stat signalling activation thorough Socs36E levels (I). Src overexpression results in transcriptional upregulation of egfr and Socs36E in the midgut. Data represent average values ± SEM. J-M Quantification of ISC proliferation in posterior midguts from animals of the indicated genotypes after 7 days of transgene expression. Knockdown of EGFR/Ras in ISC/EBs suppresses hyperproliferation in Src-overexpressing midguts (J–L). Knockdown of Stat but not the domeless receptor suppresses hyperproliferation in Src-overexpressing midguts (M). Data represent average values ± SEM (***< 0.0001 one-way ANOVA with Bonferroni’s multiple comparison test).
Figure 6
Figure 6. SFKs are redundantly required for mouse intestinal homeostasis
A–C H&E staining of small intestines from a control mouse (A) or mice subject to 4 days of intestinal epithelial knockout of Src only (AhCre; Srcfl/fll) (B) or in combination with constitutive knockout of Fyn and Yes (AhCre; Srcfl/fll; Fyn−/−; Yes−/−) (C). Scale bars, 100 μm. D–I Small intestines from mice as in (A–C) stained with anti-cleaved caspase-3 (D–F’’) and anti-lysozyme (G–I). Close up views (F’, F’’) from boxed areas in (F). Combined loss of Src, Fyn and Yes leads to villae apoptosis (F–F’’ arrows) and loss of Paneth cells (I). Scale bars, 100 μm. J Quantification of villae apoptosis from intestines as in (D–F). Data represent average values ± SEM (**< 0.001 one-way ANOVA with Bonferroni’s multiple comparison test). K Quantification of the percentage Paneth cells per crypt from intestines as in (G–I). Data represent mean values ± SEM (***< 0.0001 one-way ANOVA with Bonferroni’s multiple comparison test). L–O In vitro organoid formation from intestinal crypts of mice of the indicated genotypes. Note that combined loss of Src, Fyn and Yes from the intestinal epithelium prevents organoid formation. P Quantification of the percentage of organoids formed per 100 crypts seeded. Organoids were scored 1 week after seeding. Data represent average values from two independent experiments ± SEM (***< 0.0001 one-way ANOVA with Bonferroni’s multiple comparison test). N.S.: statistically not significant).
Figure 7
Figure 7. Src is required for mouse intestinal regeneration
A, B pSrc immunostaining of mouse small intestines from unchallenged control animals or 72 h following DNA damage by gamma irradiation (14 Gy for 72 h). The dotted lines indicate the proliferative crypt domain of the intestine. Scale bars, 200 μm. C, D H&E staining showing regeneration after DNA damage in the small intestine of a control mouse or following Src deletion from the intestinal epithelium (AhCre; Srcfl/fl). Conditional Src deletion from the intestinal epithelium resulted in significantly impaired regeneration. pSrc immunostaining of irradiated AhCre; Srcfl/fl intestines is shown in (D’). Arrows in (C–D’) point to regenerating intestinal crypts. Scale bars, 200 μm. E, F Quantification of the number of crypts in control and AhCre; Srcfl/fl intestines before and after irradiation. Data are presented as dot plots indicating mean values from all mice scored ± SEM. Each dot represents average value per animal (**P = 0.0016 Unpaired t-test). G–L pErk1/2 (G–I) and pStat3 (J-L) immunostaining of small intestines from control, unirradiated (G, J), irradiated control (H, K) and AhCre; Srcfl/fl mice (I, L). Arrows point to regenerating intestinal crypts. Scale bars, 100 µm. M, N Quantification of the percentage pErk1/2+ve and pStat3+ve cells per crypt from intestines as in (G–L). Data represent mean values ± SEM (***< 0.0001; **< 0.001 one-way ANOVA with Bonferroni’s multiple comparison test).
Figure 8
Figure 8. Src is required for Apc-dependent tumourigenesis in the mouse intestine
A, B Kaplan–Meier survival analysis of animals of the indicated genotypes showed increased survival of animals with combined Apc and Src deletion in the intestine. Src deletion significantly suppressed tumourigenesis in Lgr5-CreER; Apcfl/fl (A) and ApcMin/+ (B) mouse models of colorectal cancer. The P-values of a log-rank test are shown in each panel. C Intestinal tumour burden (tumour number/tumour area) in Min; AhCre Srcfl/+ (control) and Min; AhCre Srcfl/fl mice. Data are presented as dot plots indicating mean values from all mice scored ± SEM. Each dot represents average tumour burden per animal (*P = 0.018, unpaired t-test). D Percentage tumour type scored in small intestines from animals as in (C). E, F BrdU scores from the different tumour types in small intestines from mice as in (C). Src deletion from the intestinal epithelium results in reduced proliferation in small/medium and big adenomas from ApcMin/+ mice (F) (****< 0.0001, chi-square test). G, H BrdU immunostaining in big adenomas from mice of the indicated genotypes. Scale bars, 100 µm.
Figure 9
Figure 9. A conserved role of Src in intestinal regeneration and tumourigenesis
dSrc42/c-Src is activated in response to damage and upon Wg/Wnt signalling upregulation within stem/progenitor cells of the adult Drosophila midgut and mouse small intestine leading to tissue hyperproliferation. Src knockdown prevents intestinal regeneration and tumourigenesis in both model systems. ISC/EB: intestinal stem cell/enteroblast; EC: enterocyte; ee: enteroendocrine cell; TA: transit-amplifying cell; Paneth: Paneth cell.

Comment in

References

    1. Ahmed Y, Hayashi S, Levine A, Wieschaus E. Regulation of armadillo by a Drosophila APC inhibits neuronal apoptosis during retinal development. Cell. 1998;93:1171–1182. - PubMed
    1. Amcheslavsky A, Jiang J, Ip YT. Tissue damage-induced intestinal stem cell division in Drosophila. Cell Stem Cell. 2009;4:49–61. - PMC - PubMed
    1. Andreu P, Colnot S, Godard C, Gad S, Chafey P, Niwa-Kawakita M, Laurent-Puig P, Kahn A, Robine S, Perret C, Romagnolo B. Crypt-restricted proliferation and commitment to the Paneth cell lineage following Apc loss in the mouse intestine. Development. 2005;132:1443–1451. - PubMed
    1. Ashton GH, Morton JP, Myant K, Phesse TJ, Ridgway RA, Marsh V, Wilkins JA, Athineos D, Muncan V, Kemp R, Neufeld K, Clevers H, Brunton V, Winton DJ, Wang X, Sears RC, Clarke AR, Frame MC, Sansom OJ. Focal adhesion kinase is required for intestinal regeneration and tumorigenesis downstream of Wnt/c-Myc signaling. Dev Cell. 2010;19:259–269. - PMC - PubMed
    1. Barker N, Ridgway RA, van Es JH, van de Wetering M, Begthel H, van den Born M, Danenberg E, Clarke AR, Sansom OJ, Clevers H. Crypt stem cells as the cells-of-origin of intestinal cancer. Nature. 2009;457:608–611. - PubMed

Publication types

MeSH terms