

Spectral-domain optical coherence tomography of the rodent eye: highlighting layers of the outer retina using signal averaging and comparison with histology
- PMID: 24788712
- PMCID: PMC4008571
- DOI: 10.1371/journal.pone.0096494
Spectral-domain optical coherence tomography of the rodent eye: highlighting layers of the outer retina using signal averaging and comparison with histology
Abstract
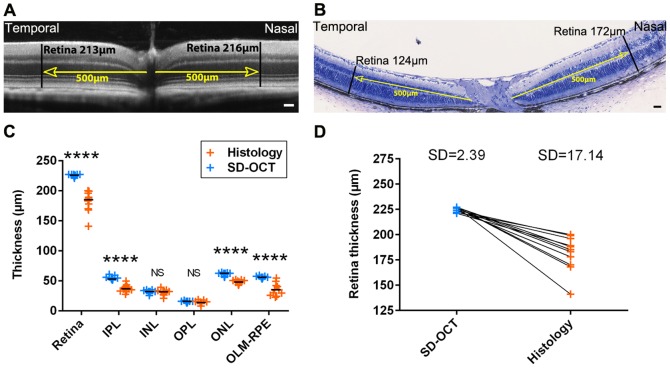
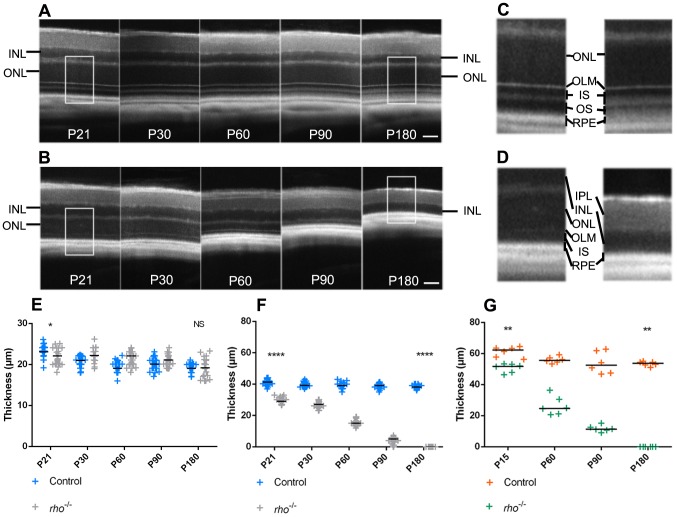
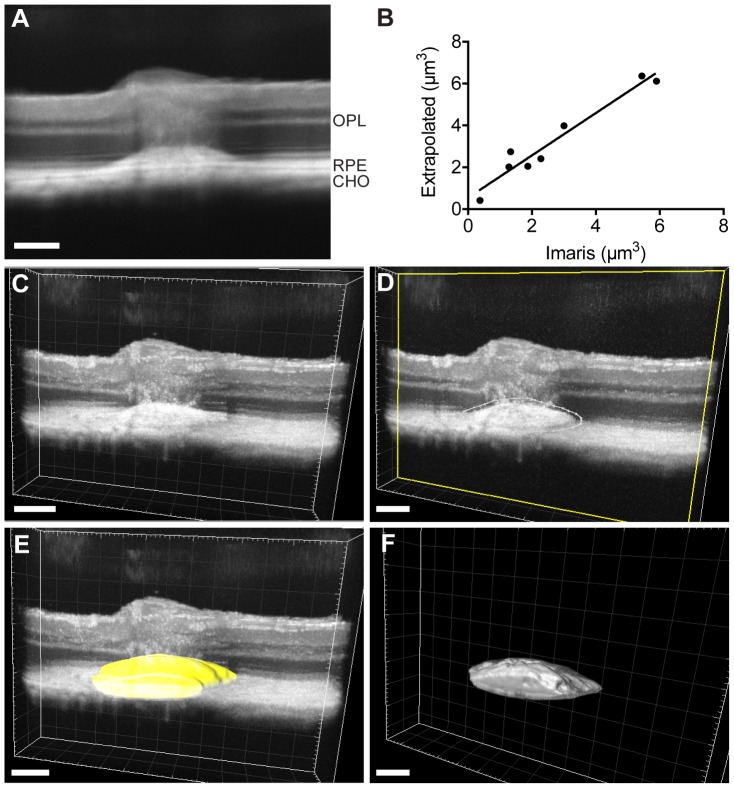
Spectral-Domain Optical Coherence Tomography (SD-OCT) is a widely used method to observe retinal layers and follow pathological events in human. Recently, this technique has been adapted for animal imaging. This non-invasive technology brings a cross-sectional visualization of the retina, which permits to observe precisely each layer. There is a clear expansion of the use of this imaging modality in rodents, thus, a precise characterization of the different outer retinal layers observed by SD-OCT is now necessary to make the most of this technology. The identification of the inner strata until the outer nuclear layer has already been clearly established, while the attribution of the layers observed by SD-OCT to the structures corresponding to photoreceptors segments and retinal pigment epithelium is much more questionable. To progress in the understanding of experimental SD-OCT imaging, we developed a method for averaging SD-OCT data to generate a mean image allowing to better delineate layers in the retina of pigmented and albino strains of mice and rats. It allowed us to locate precisely the interface between photoreceptors and retinal pigment epithelium and to identify unambiguously four layers corresponding to the inner and outer parts of photoreceptors segments. We show that the thickness of the various layers can be measured as accurately in vivo on SD-OCT images, than post-mortem by a morphometric analysis of histological sections. We applied SD-OCT to different models and demonstrated that it allows analysis of focal or diffuse retinal pathological processes such as mutation-dependent damages or light-driven modification of photoreceptors. Moreover, we report a new method of combined use of SD-OCT and integration to quantify laser-induced choroidal neovascularization. In conclusion, we clearly demonstrated that SD-OCT represents a valuable tool for imaging the rodent retina that is at least as accurate as histology, non-invasive and allows longitudinal follow-up of the same animal.
Conflict of interest statement
Figures


Similar articles
-
Spectral domain optical coherence tomography in mouse models of retinal degeneration.Invest Ophthalmol Vis Sci. 2009 Dec;50(12):5888-95. doi: 10.1167/iovs.09-3724. Epub 2009 Aug 6. Invest Ophthalmol Vis Sci. 2009. PMID: 19661229 Free PMC article.
-
In vivo three-dimensional high-resolution imaging of rodent retina with spectral-domain optical coherence tomography.Invest Ophthalmol Vis Sci. 2007 Apr;48(4):1808-14. doi: 10.1167/iovs.06-0815. Invest Ophthalmol Vis Sci. 2007. PMID: 17389515
-
Monitoring mouse retinal degeneration with high-resolution spectral-domain optical coherence tomography.J Vis. 2008 Jan 24;8(1):17.1-11. doi: 10.1167/8.1.17. J Vis. 2008. PMID: 18318620
-
Optical Coherence Tomography of Animal Models of Retinitis Pigmentosa: From Animal Studies to Clinical Applications.Biomed Res Int. 2019 Oct 30;2019:8276140. doi: 10.1155/2019/8276140. eCollection 2019. Biomed Res Int. 2019. PMID: 31781647 Free PMC article. Review.
-
Optical coherence tomography imaging in uveitis.Int Ophthalmol. 2014 Apr;34(2):401-35. doi: 10.1007/s10792-013-9822-7. Epub 2013 Jul 9. Int Ophthalmol. 2014. PMID: 23835664 Review.
Cited by
-
A Population Study of Common Ocular Abnormalities in C57BL/6N rd8 Mice.Invest Ophthalmol Vis Sci. 2018 May 1;59(6):2252-2261. doi: 10.1167/iovs.17-23513. Invest Ophthalmol Vis Sci. 2018. PMID: 29847629 Free PMC article.
-
A comparison of optophysiological biomarkers of photoreceptor stress and phototoxicity in BALB/cJ, B6 (Cg)-Tyrc-2J/J, and C57Bl/6J mouse strains.Front Ophthalmol (Lausanne). 2023;3:1128311. doi: 10.3389/fopht.2023.1128311. Epub 2023 Mar 29. Front Ophthalmol (Lausanne). 2023. PMID: 38689597 Free PMC article.
-
IRBP deficiency permits precocious ocular development and myopia.Mol Vis. 2016 Oct 27;22:1291-1308. eCollection 2016. Mol Vis. 2016. PMID: 27829784 Free PMC article.
-
A Simple Optical Coherence Tomography Quantification Method for Choroidal Neovascularization.J Ocul Pharmacol Ther. 2015 Oct;31(8):447-54. doi: 10.1089/jop.2015.0049. Epub 2015 Jun 10. J Ocul Pharmacol Ther. 2015. PMID: 26060878 Free PMC article.
-
Deletion of IFT20 exclusively in the RPE ablates primary cilia and leads to retinal degeneration.PLoS Biol. 2023 Dec 4;21(12):e3002402. doi: 10.1371/journal.pbio.3002402. eCollection 2023 Dec. PLoS Biol. 2023. PMID: 38048369 Free PMC article.
References
-
- Chang B, Hawes NL, Hurd RE, Davisson MT, Nusinowitz S, et al. (2002) Retinal degeneration mutants in the mouse. Vision Res 42: 517–525. - PubMed
-
- McLean M, Prothero JW (1991) Three-dimensional reconstruction from serial sections. V. Calibration of dimensional changes incurred during tissue preparation and data processing. Anal Quant Cytol Histol 13: 269–278. - PubMed
-
- Margo CE, Lee A (1995) Fixation of whole eyes: the role of fixative osmolarity in the production of tissue artifact. Graefes Arch Clin Exp Ophthalmol 233: 366–370. - PubMed
-
- Sharp PF, Manivannan A, Xu H, Forrester JV (2004) The scanning laser ophthalmoscope–a review of its role in bioscience and medicine. Phys Med Biol 49: 1085–1096. - PubMed
-
- Paques M, Simonutti M, Roux MJ, Picaud S, Levavasseur E, et al. (2006) High resolution fundus imaging by confocal scanning laser ophthalmoscopy in the mouse. Vision Res 46: 1336–1345. - PubMed
Publication types
MeSH terms
Substances
LinkOut - more resources
Full Text Sources
Other Literature Sources
Molecular Biology Databases
