. 2014 Apr 30;9(4):e95663.
doi: 10.1371/journal.pone.0095663. eCollection 2014.

Geminin overexpression promotes imatinib sensitive breast cancer: a novel treatment approach for aggressive breast cancers, including a subset of triple negative

Affiliations

Geminin overexpression promotes imatinib sensitive breast cancer: a novel treatment approach for aggressive breast cancers, including a subset of triple negative

Zannel Blanchard et al. PLoS One. .

Abstract

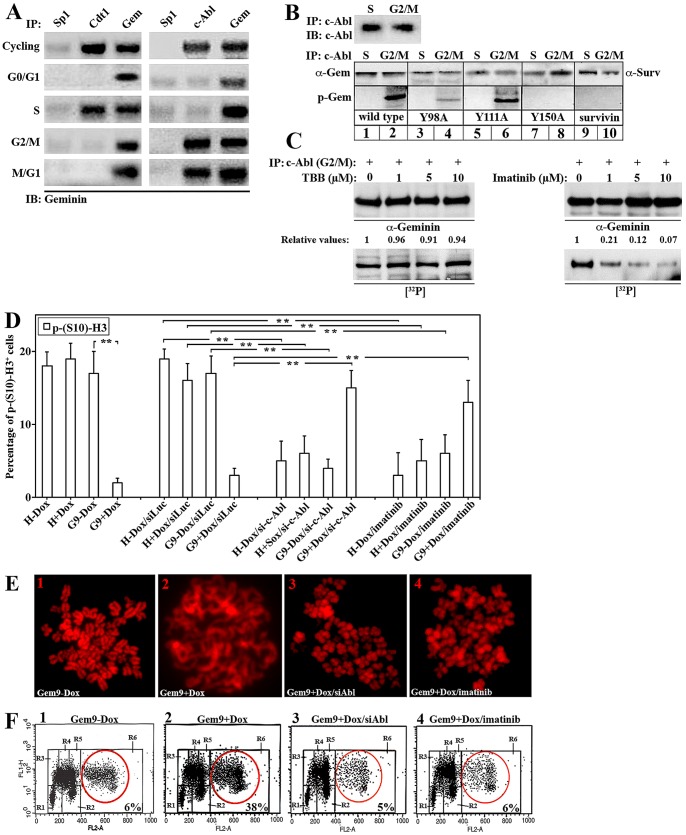
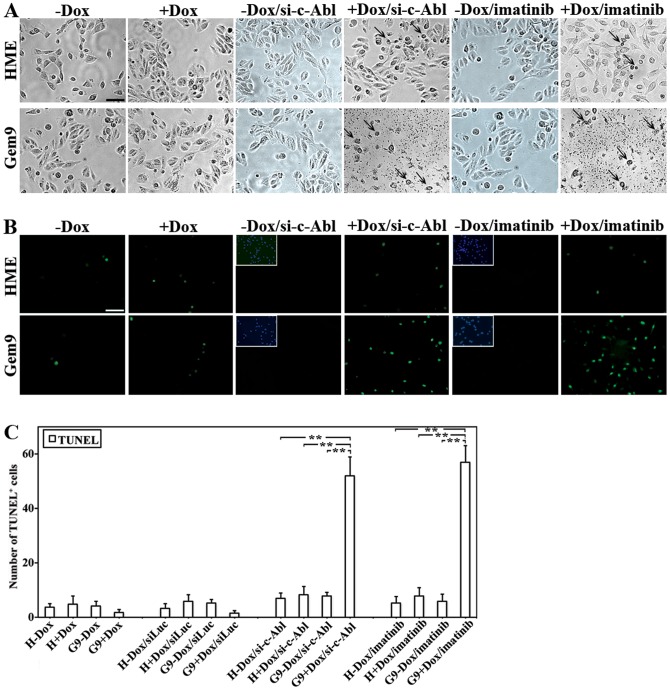
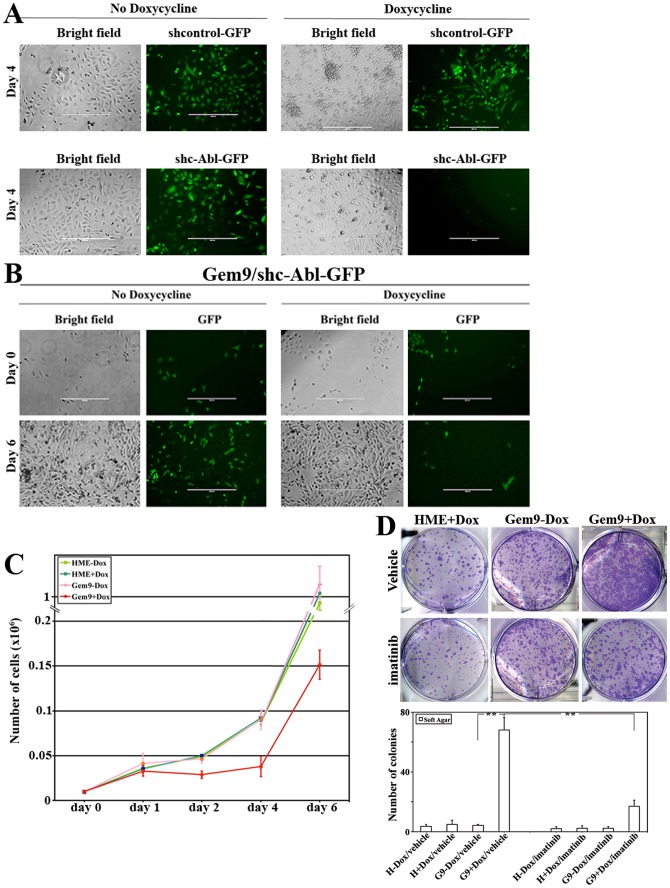
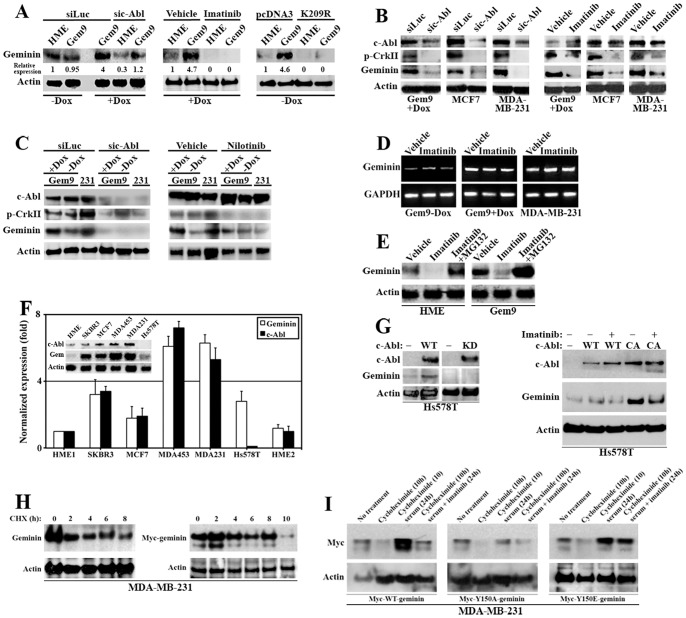
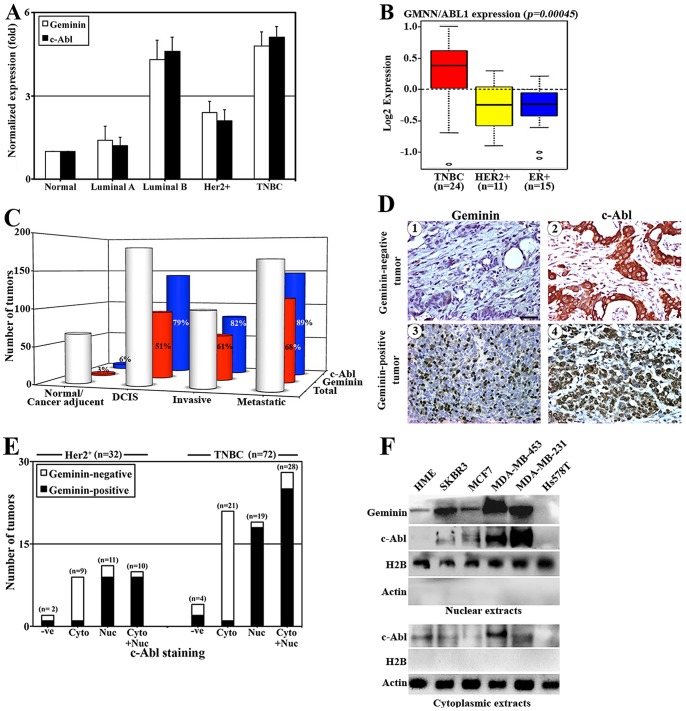
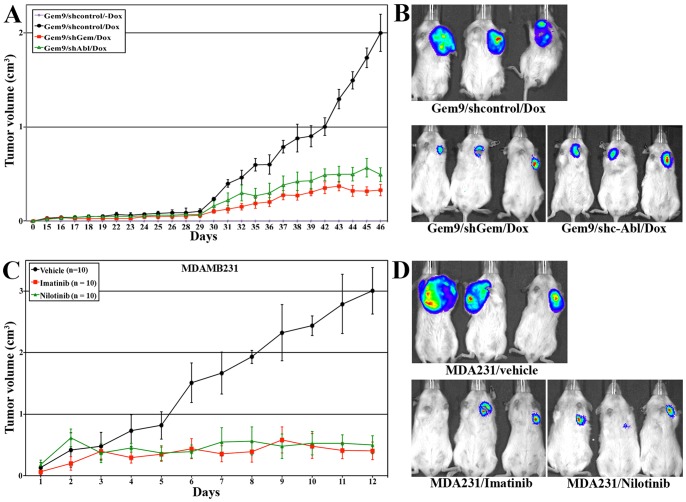
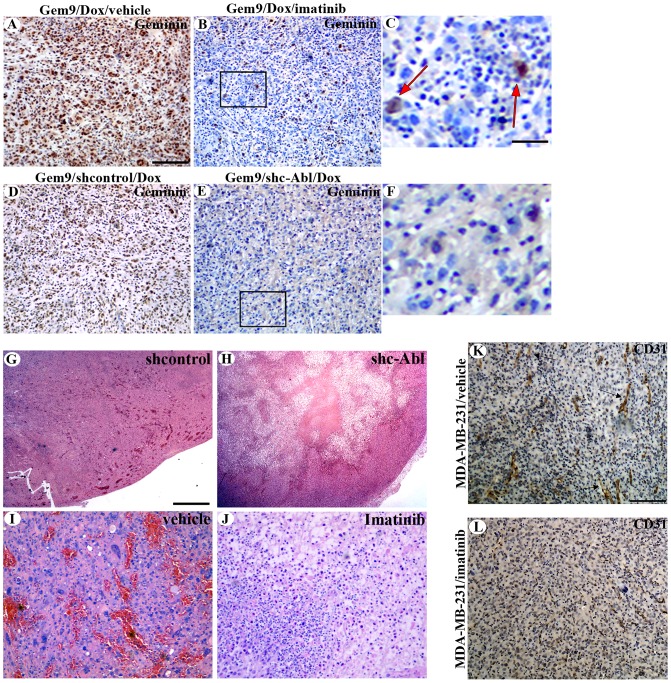
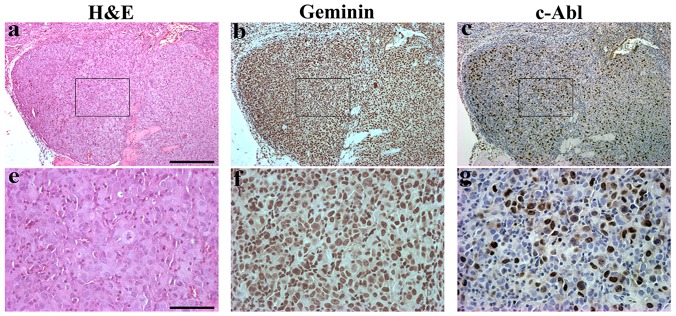
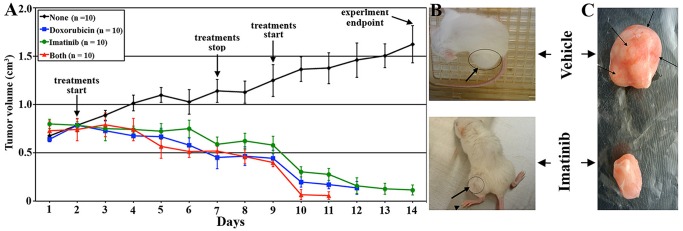
Breast cancer is the second leading cause of cancer-related deaths in women. Triple negative breast cancer (TNBC) is an aggressive subtype that affects 10-25% mostly African American women. TNBC has the poorest prognosis of all subtypes with rapid progression leading to mortality in younger patients. So far, there is no targeted treatment for TNBC. To that end, here we show that c-Abl is one of several tyrosine kinases that phosphorylate and activate geminin's ability to promote TNBC. Analysis of >800 breast tumor samples showed that geminin is overexpressed in ∼50% of all tumors. Although c-Abl is overexpressed in ∼90% of all tumors, it is only nuclear in geminin overexpressing tumors. In geminin-negative tumors, c-Abl is only cytoplasmic. Inhibiting c-Abl expression or activity (using imatinib or nilotinib) prevented geminin Y150 phosphorylation, inactivated the protein, and most importantly converted overexpressed geminin from an oncogene to an apoptosis inducer. In pre-clinical orthotopic breast tumor models, geminin-overexpressing cells developed aneuploid and invasive tumors, which were suppressed when c-Abl expression was blocked. Moreover, established geminin overexpressing orthotopic tumors regressed when treated with imatinib or nilotinib. Our studies support imatinib/nilotonib as a novel treatment option for patients with aggressive breast cancer (including a subset of TNBCs)-overexpressing geminin and nuclear c-Abl.


Conflict of interest statement

Competing Interests: The authors have declared that no competing interests exist.

Figures

Figure 1
Figure 1. c-Abl binding and phosphorylation of geminin Y150 in G2/M/early G1 cells promotes overexpressed geminin oncogenicity in HME cells.
(A) Immunoprecipitation of cycling, G0/G1, S, G2/M or M/G1 HME cells with anti-Cdt1, -c-Abl, -Sp1 (negative control) and -geminin antibodies. (B) c-Abl immunoprecipitated from S or G2/M HME cells (upper panels) was used to in vitro phosphorylate GST-WT-, -Y98A-, -Y111A-, -Y150A-geminin or GST-survivin (negative control, lower panels). (C) c-Abl immunoprecipitated from G2/M was used to in vitro phosphorylate GST-WT-geminin in the presence of the increasing concentrations of CKII inhibitor, TBB (left panels) or c-Abl inhibitor, imatinib (right panels). (D) The percentage of p-(S10)-H3+-cells in HME, uninduced or induced Gem9 following transfection of si-control or si-c-Abl (for 72 hr) or treatment with vehicle or 5 µM of imatinib (during the last 24 h). Data are represented as mean ± SD of triplicates done three separate times, where *  =  p0.05 and **  =  p0.001. (E) Metaphase spread analysis of chromosome condensation in uninduced or induced Gem9 cells before or after transfection of sic-Abl or treatment with 5 µM of imatinib. (F) FACS analysis of uninduced or induced Gem9 cells transfection of sic-Abl or treatment with 5 µM of imatinib. Aneuploid cells are shown in the red circles and their percentage is in insets. R1 = G0/G1, R3/R4/R5 = early/mid/late S, R2 = G2/M and R6 = >4N cells. Experiments were done three separate times in triplicates.
Figure 2
Figure 2. c-Abl silencing or inactivation promotes cell death, specifically, in geminin overexpressing cells and prevents transformation.
(A) Phase contrast images showing naïve HME, uninduced and induced Gem9 cultures following transfection of sic-Abl or treatment with 10 µM of imatinib. Scale bar  =  50 µm. (B) Representative images showing TUNEL+-cells in naïve HME, uninduced and induced Gem9 cultures following transfection of sic-Abl or treatment with 10 µM of imatinib. Inset is DAPI stained cells in the corresponding images. Scale bar  =  100 µm. (C) Number of TUNEL+-cells in naïve HME, uninduced and induced Gem9 cultures after c-Abl silencing or inactivation with imatinib. Data are represented as mean ± SD of triplicates done 3 separate times, where **  =  p0.01 and ***  =  p0.0001.
Figure 3
Figure 3. Death of geminin overexpressing cells specifically in the absence of c-Abl.
(A) Representative bright field and fluorescence images showing naïve HME, uninduced and induced Gem9 cells transfected with sh-control or shc-Abl and grown in the presence or absence of doxycycline for 4 days. Scale bar  =  400 µm. (B) Representative bright-filed and fluorescence images of Gem 9 cells expressing sh-control or shc-Abl and grown in the presence or absence of doxycycline for 0 or 6 days. Scale bar  =  400 µm. (C) Quantitative analysis of the data in (A) and (B). (D) Phase contrast images showing colony formed in soft agar using naïve HME, uninduced and induced Gem9 cultures before or after treatment with 10 µM of imatinib (upper) Quantitative analysis of the soft agar experiment described in (lower). Data are represented as mean ± SD from triplicates done 3 separate times. ***  =  p<0.001.
Figure 4
Figure 4. Stabilization of geminin protein by c-Abl phosphorylation and the expression of geminin and c-Abl in breast cancer cell lines.
(A) The expression level of geminin in naïve HME, uninduced and induced Gem9 cells following c-Abl silencing or inactivation using imatinib or transfection of the dominant negative c-Abl (K290R). (B) The expression of c-Abl, geminin, p-CrkII in induced Gem9, MCF7 or MDA-MB-231 cells silenced from c-Abl or treated with imatinib. (C) The expression level of c-Abl, p-CrkII and geminin in induced Gem9 or MDA-MB-231 cells silenced of c-Abl or treated with nilotinib. (D) RT/PCR analysis of geminin mRNA in uninduced, induced Gem9 or MDA-MB-231 cells in the presence of vehicle or imatinib. (E) The expression of geminin in naïve HME or induced Gem9 cells in the presence of vehicle, imatinib or imatinib + MG132. (F) The expression of c-Abl and geminin mRNAs and proteins (inset) in several breast cancer cell lines. Note that Hs578T cells express high level of geminin mRNA, but no protein. (G) The re-expression of geminin in Hs578T cells reconstituted with WT and not kinase dead (KD) c-Abl (left). The re-expression of geminin in Hs578T cells reconstituted with WT or constitutively active (CA) c-Abl was blocked by imatinib (right). (H) The expression of endogenous (left) or overexpressed (right) geminin in MDA-MB-231 cells following treatment with the translational inhibitor cycloheximide (CHX) for 0-10 h with cells collected at 2 h intervals. (I) The expression of exogenous Myc tagged WT- (left), Y150A- (middle) or Y150E- (right)-geminin following no treatment (1st lanes), 10 h of CHX (2nd lanes), 10 h CHX followed by 24 h of complete serum (3rd lanes) or 10 h CHX followed by 24 h of complete serum + 10 µM of imatinib (4th lanes).
Figure 5
Figure 5. The expression of geminin and c-Abl in breast tumor samples.
(A) The normalized expression of geminin and c-Abl mRNA in normal (n = 5), luminal A (n = 7), luminal B (n = 9), Her2+ (n = 11) and TN/BL (n = 7) tumor samples. (B) Box plot of gene expression for combined gene set of geminin and c-Abl across cell lines grouped into clinical subtypes; triple negative breast cancer (TNBC, red), HER2-positive (HER2, yellow), and ER-positive (ER+, blue) based on annotation data from (38). (C) Number of total, geminin-positive and c-Abl-positive tumors detected using immunohistochemistry on normal/cancer adjacent (n = 66), DCIS (n = 180), invasive (n = 100) and metastatic (n = 165) breast tumors. (D) Representative immunohistochemical staining images of geminin (1 and 3) or -c-Abl (2 and 4) on invasive breast tumor samples. Scale bar  =  50 µm. (E) Number of geminin-positive or -negative in Her2+ (n = 32) or TN/BL (n = 72) showing cytoplasmic (Cyt), nuclear (Nuc), or both (Cyt + Nuc) c-Abl expression. (F) The level of geminin and c-Abl in the nuclear or cytoplasmic fractions of the indicated cell lines.
Figure 6
Figure 6. Geminin/c-Abl overexpression decreases the overall survival and increase hazard ratio in breast cancer patients.
(A) Kaplan-Meier analysis for disease free survival (DFS) of patients expressing high, middle or low levels of geminin in their breast tumors. (B) Kaplan-Meier analysis for DFS of patients expressing high, middle or low levels of c-Abl in their breast tumors. (C) Kaplan-Meier analysis for DFS of patients expressing high vs. middle vs. low levels of geminin + c-Abl in their breast tumors. (D) Multi-variants analysis of the hazard ratio (estimated mean survival with 95% CI) plotted against tumor size, age, grade 3, lymph-node (LN)-negativity, ER-positivity. Kaplan-Meier analysis for overall survival (OS) of patients expressing high, middle or low levels of geminin + c-Abl in their grade 1 (E) or grade 3 (F) breast tumors.
Figure 7
Figure 7. The effect of c-Abl silencing or inactivation on geminin-driven mammary tumors.
(A, left) The volumes of geminin-driven orthotopic tumors following expression of sh-control (black line, n  = 10), shc-Abl (green line, n = 10) or sh-geminin (red line, n = 10) in Gem9 cells. All mice were kept on doxycycline containing drinking water throughout the experiment. A set of 10 mice were injected with Gem9 cells and kept on no doxycycline water (purple line). (A, right) Representative luciferase images taken at day 45 of tumors shown in (A, left). (B, left) The volumes of MDAMB231 orthotopic tumors following treatment with vehicle (black line, n  = 10), imatinib (red line, n = 10) or nilotinib (green line, n = 10). (B, right) Representative luciferase images taken at day 12 of tumors shown in (B, left).
Figure 8
Figure 8. Histological and immunohistochemical analysis of geminin overexpressing mammary tumors following c-Abl silencing or inactivation.
Immunohistochemical staining of induced Gem9 tumors treated with vehicle (A), imatinib (B and C), expressing control shRNA (D) or c-Abl shRNA (E and F). H&E stained induced Gem9 tumor expressing control (G) or c-Abl (H) shRNA. H&E stained induced Gem9 tumor following treatment with vehicle (I) or imatinib (J). Scale bar in A, B, D, E, I and J = 200 µm, in C and F = 50 µm and in G and H = 500 µm. (K and L) CD31 staining on section from MDA-MB-231 tumors treated with vehicle (arrows, K) or imatinib (E) treated geminin-driven tumors. Scale bar = 200 µm.
Figure 9
Figure 9. Histological and immunohistochemical analysis of geminin overexpressing mammary tumors.
(a and e) Representative H&E stained sections from induced Gem9 orthotopic mammary tumors. (b and C) and (f and g) adjacent sections to those shown in (a and e) stained with geminin (b and f) or c-Abl (c and g). Scale bars in a-c = 500 µm and d-f =  100 µm.
Figure 10
Figure 10. The efficacy of imatinib against geminin overexpressing tumors.
(A) Tumors developed orthotopically or subcutaneously using induced Gem9 cells were treated when reached 0.5–0.75 cm3 with doxorubicin (blue line, n = 10), imatinib (green line, n = 10) or both (red line, n = 10) daily (weekend off) for 14 days. Black line shows vehicle treated tumors (n = 10) as described above. Representative subcutaneously (B) or orthotopically (C) developed tumors following vehicle (uppers) or imatinib (lower) treatments.

Similar articles

Cited by

References

    1. McGarry T, Kirschner M (2011) Geminin, an inhibitor of DNA replication, is degraded during mitosis. Cell 93(6): 1043–5321. - PubMed
    1. Wohlschlegel J, Dwyer B, Dhar S, Cvetic C, Walter J, et al. (2000) Inhibition of eukaryotic DNA replication by geminin binding to Cdt1. Science 290: 2309–2312. - PubMed
    1. Thépaut M, Maiorano D, Guichou J, Augé M, Dumas C, et al. (2004) Crystal structure of the coiled-coil dimerization motif of geminin: structural and functional insights on DNA replication regulation. J Mol Biol 342(1): 275–287. - PubMed
    1. Kroll K, Salic A, Evans L, Kirschner M (1998) Geminin, a neutralizing molecule that demarcates the future neural plate at the onset of gastrulation. Development 125: 3247–3258. - PubMed
    1. Del Bene F, Tessmar-Raible K, Wittbrodt J (2004) Direct interaction of geminin and Six3 in eye development. Nature 427: 745–749. - PubMed

Publication types

MeSH terms