. 2014 Apr 30;281(1785):20140268.
doi: 10.1098/rspb.2014.0268. Print 2014 Jun 22.

Social mixing patterns in rural and urban areas of southern China

Affiliations

Social mixing patterns in rural and urban areas of southern China

Jonathan M Read et al. Proc Biol Sci. .

Abstract

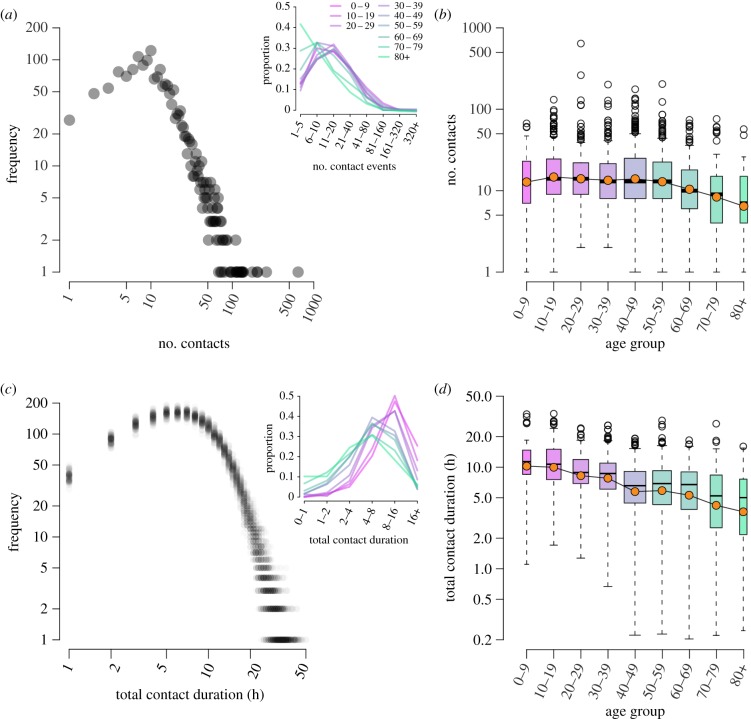
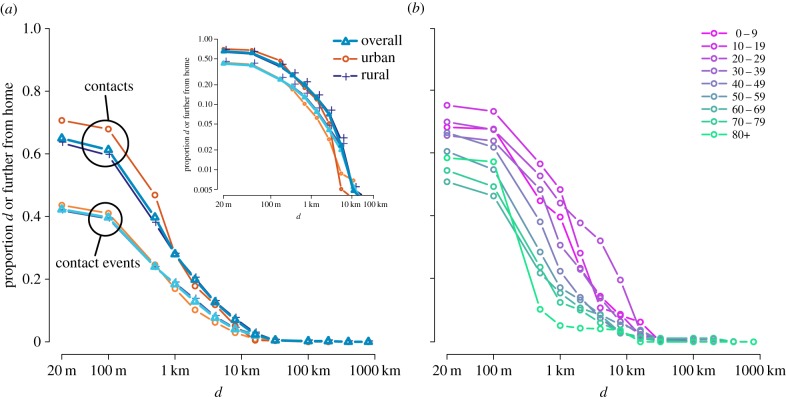
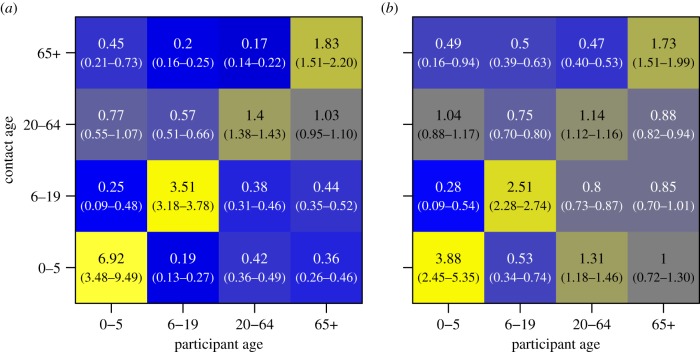
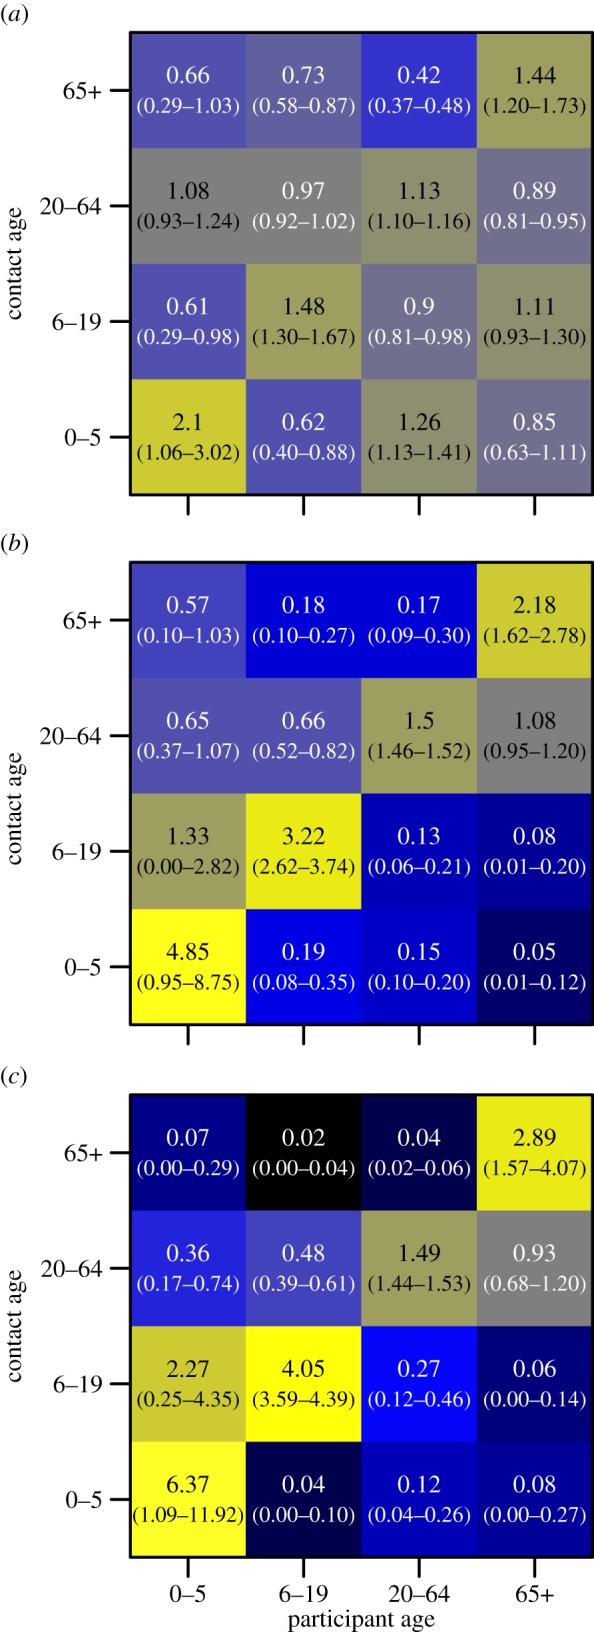
A dense population, global connectivity and frequent human-animal interaction give southern China an important role in the spread and emergence of infectious disease. However, patterns of person-to-person contact relevant to the spread of directly transmitted infections such as influenza remain poorly quantified in the region. We conducted a household-based survey of travel and contact patterns among urban and rural populations of Guangdong, China. We measured the character and distance from home of social encounters made by 1821 individuals. Most individuals reported 5-10 h of contact with around 10 individuals each day; however, both distributions have long tails. The distribution of distance from home at which contacts were made is similar: most were within a kilometre of the participant's home, while some occurred further than 500 km away. Compared with younger individuals, older individuals made fewer contacts which tended to be closer to home. There was strong assortativity in age-based contact rates. We found no difference between the total number or duration of contacts between urban and rural participants, but urban participants tended to make contacts closer to home. These results can improve mathematical models of infectious disease emergence, spread and control in southern China and throughout the region.

Keywords: contact diary; infectious disease transmission; influenza; mathematical modelling; social mixing; travel.


Figures

Figure 1.
Figure 1.
(a) The log–log distribution of number of contacts reported by participants. The inset shows the proportional distribution across log-binned contact number, split by age group of participant. (b) Boxplot of number of contacts reported by age group of participant; log-means are denoted by coloured circles. (c) The log–log distribution of total contact duration (rounded up to nearest hour); here, we show total durations from 100 re-samples with translucent points to illustrate the variation in assigned contact durations. The inset shows the proportional distribution across log-binned durations, by participant age group. (d) Total contact duration by age group. One participant reported zero contacts: they are in the 70-79 year age group and excluded from these plots.
Figure 2.
Figure 2.
Inverse cumulative distance kernels for the number of contacts and number of contact events, showing the proportion of each made at (or further) particular distances from home. Distances are from the home location of each participant to the location where contact occurred, in kilometres. (a) Distance kernels for number of contacts and contact events, and those made by participants living in urban and rural locations (administratively defined); inset shows a linear-scale version. (b) Distance kernels for the number of contacts made for each participant age group.
Figure 3.
Figure 3.
Age-based mixing matrices for (a) total number of contacts and (b) total contact duration. Values are the ratio of observed contact rates to those expected assuming proportionate mixing using national-scale demographic data. Bluer colours indicate less mixing between age groups than expected by random mixing, and yellower colours indicate more mixing. 95% CIs are shown in parentheses, derived from 1000 re-samples of participant contact diaries.
Figure 4.
Figure 4.
Age-based mixing matrices for total number of contacts, stratified by (a) within household, (b) non-household and less than 0.5 km from home, and (c) non-household and greater or equal to 0.5 km. The colour scales are the same as for figure 3.

References

    1. Tellier R. 2006. Review of aerosol transmission of influenza A virus. Emerg. Infect. Dis. 12, 1657–1662. (10.3201/eid1211.060426) - DOI - PMC - PubMed
    1. Brankston G, Gitterman L, Hirji Z, Lemieux C, Gardam M. 2007. Transmission of influenza A in human beings. Lancet Infect. Dis. 7, 257–265. (10.1016/S1473-3099(07)70029-4) - DOI - PubMed
    1. Musher DM. 2003. How contagious are common respiratory tract infections? N. Engl. J. Med. 348, 1256–1266. (10.1056/NEJMra021771) - DOI - PubMed
    1. Read JM, Edmunds WJ, Riley S, Lessler J, Cummings DA. 2012. Close encounters of the infectious kind: methods to measure social mixing behaviour. Epidemiol. Infect. 140, 2117–2130. (10.1017/S0950268812000842) - DOI - PMC - PubMed
    1. Rea E, et al. 2007. Duration and distance of exposure are important predictors of transmission among community contacts of Ontario SARS cases. Epidemiol. Infect. 135, 914–921. (10.1017/S0950268806007771) - DOI - PMC - PubMed

Publication types

LinkOut - more resources