. 2014 Jun;124(6):2497-512.
doi: 10.1172/JCI71533. Epub 2014 May 1.

MHC-derived allopeptide activates TCR-biased CD8+ Tregs and suppresses organ rejection

MHC-derived allopeptide activates TCR-biased CD8+ Tregs and suppresses organ rejection

Elodie Picarda et al. J Clin Invest. 2014 Jun.

Abstract

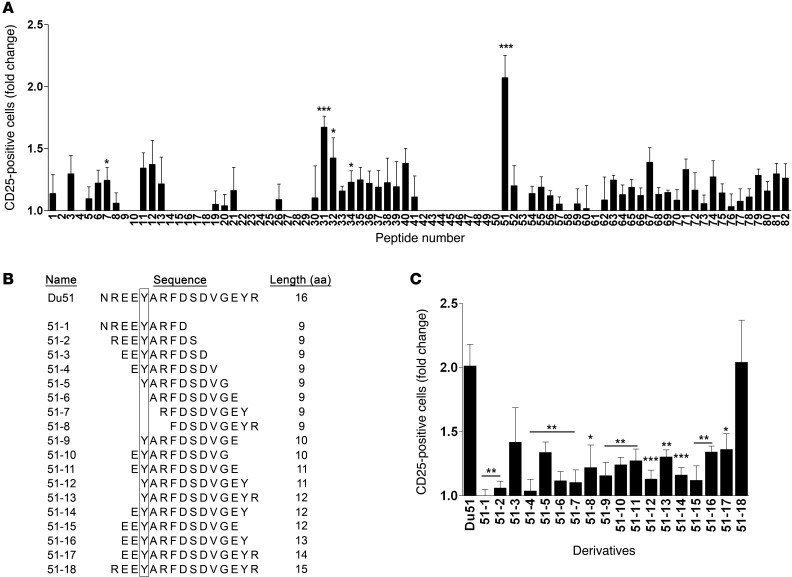
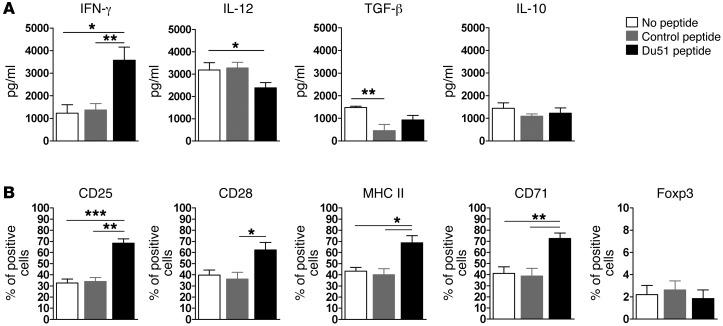
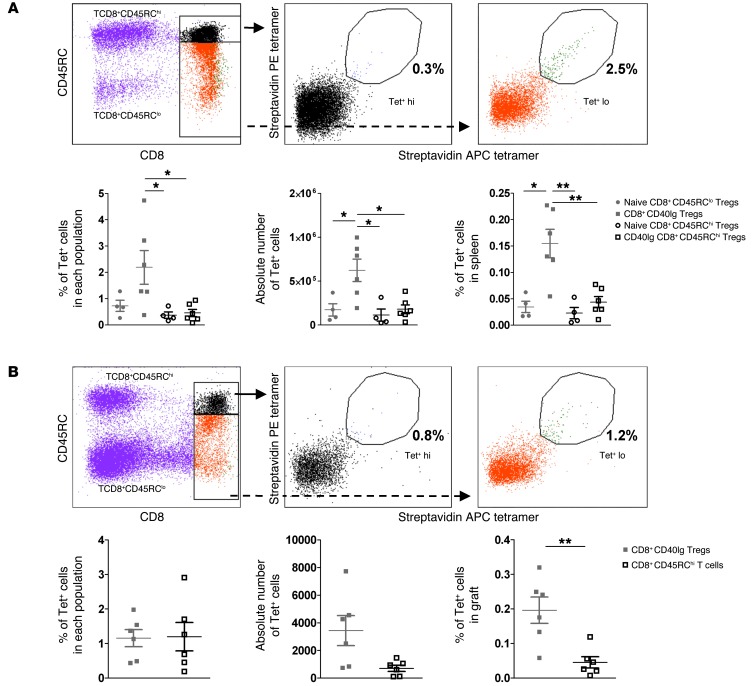
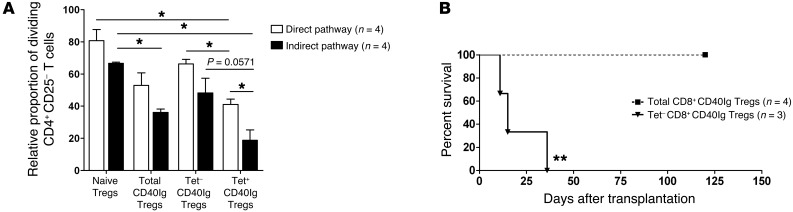
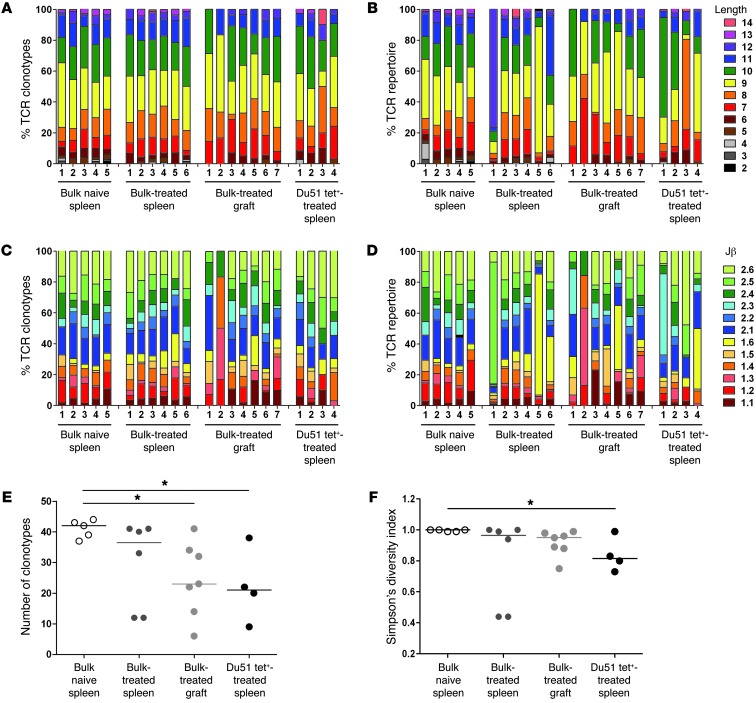
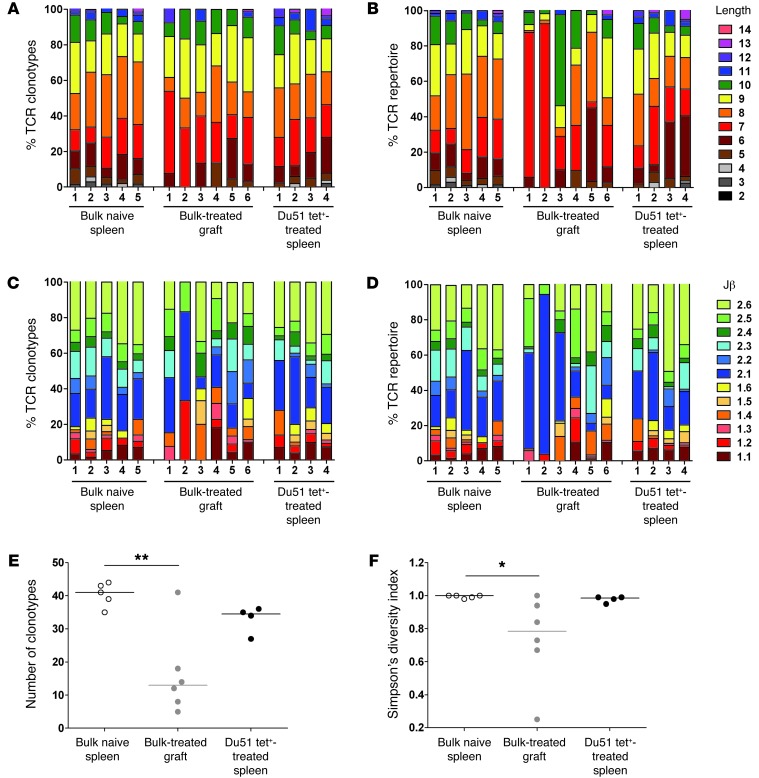
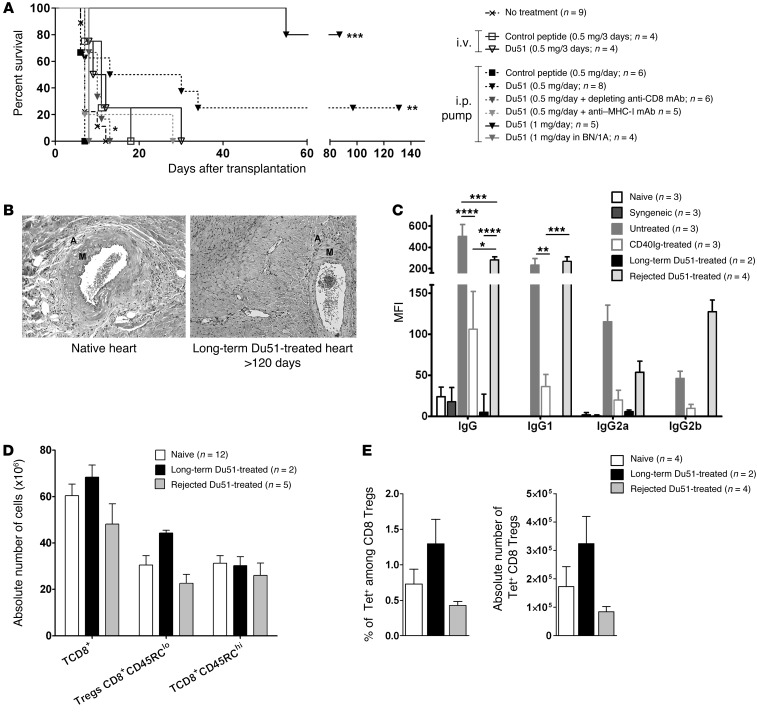
In a rat heart allograft model, preventing T cell costimulation with CD40Ig leads to indefinite allograft survival, which is mediated by the induction of CD8+CD45RClo regulatory T cells (CD8+CD40Ig Tregs) interacting with plasmacytoid dendritic cells (pDCs). The role of TCR-MHC-peptide interaction in regulating Treg activity remains a topic of debate. Here, we identified a donor MHC class II-derived peptide (Du51) that is recognized by TCR-biased CD8+CD40Ig Tregs and activating CD8+CD40Ig Tregs in both its phenotype and suppression of antidonor alloreactive T cell responses. We generated a labeled tetramer (MHC-I RT1.Aa/Du51) to localize and quantify Du51-specific T cells within rat cardiac allografts and spleen. RT1.Aa/Du51-specific CD8+CD40Ig Tregs were the most suppressive subset of the total Treg population, were essential for in vivo tolerance induction, and expressed a biased, restricted Vβ11-TCR repertoire in the spleen and the graft. Finally, we demonstrated that treatment of transplant recipients with the Du51 peptide resulted in indefinite prolongation of allograft survival. These results show that CD8+CD40Ig Tregs recognize a dominant donor antigen, resulting in TCR repertoire alterations in the graft and periphery. Furthermore, this allopeptide has strong therapeutic activity and highlights the importance of TCR-peptide-MHC interaction for Treg generation and function.


Figures

Figure 1
Figure 1. Screening of CD8+ Treg activation markers by flow cytometry.
(A) CD8+CD45RClo Tregs were isolated from the spleens of CD40Ig-treated rats by cell sorting and analyzed for their expression of T cell activation markers on day 0 and after 1 to 6 days of polyclonal stimulation with anti-CD3/CD28 antibodies. Gray-filled histograms represent the isotype control staining. (B) Data are summarized and plotted as the means ± SEM. n = 3.
Figure 2
Figure 2. Analysis of CD8+CD45RClo Treg activation in response to donor-derived peptide stimulation.
(A) CD8+ Tregs were cocultured for 6 days with syngeneic CpG-matured pDCs in the presence of peptides. For each experiment, the percentage of CD25+ Tregs after 6 days of coculture with pDCs alone was given a value of 1. The mean value of 1 is equal to 32.85 ± 1.98%. Results are expressed as the ratio ± SEM between the percentage of CD25+ cells after peptide stimulation and the percentage of CD25+ cells in the control condition without peptide. *P < 0.05, **P < 0.01, and ***P < 0.001 versus control condition (value 1.0). n = 4–18 for each peptide. (B) Analysis of Treg activation in response to Du51 shorter peptide derivatives. On the left, 18 Du51 derivatives are detailed and classified by aa sequence length, from 9 aa to 15 aa. The box highlights mismatched aa between the donor and recipient. On the right, Treg activation in response to Du51 derivatives was analyzed by CD25 expression. CD8+ Tregs were cocultured for 6 days with syngeneic CpG-matured pDCs in the presence of each peptide. Bars represent the ratio between the percentage of CD25+ cells after peptide stimulation and the percentage of CD25+ cells in the control condition without peptide. *P < 0.05, **P < 0.01, and ***P < 0.001 versus Du51 condition. n = 3–14 for each peptide.
Figure 3
Figure 3. CD8+ Treg phenotype following ex vivo allopeptide stimulation.
(A) Tregs and syngeneic CpG-matured pDCs were cultured for 6 days alone, with a control peptide, or with peptide Du51. Expression on CD8+ Tregs of the indicated markers was analyzed in the culture supernatant by ELISA (A) or by flow cytometry (B) after in vitro stimulation. Graphs represent the mean ± SEM. *P < 0.05; **P < 0.01; ***P < 0.001. n = 4–7.
Figure 4
Figure 4. Enrichment of Du51-specific Tregs in long-term CD40Ig-treated recipients.
T cell–enriched spleen (A) and total graft (B) from long-surviving recipients or from naive animals were incubated with RT1.Aa/Du51 tetramers labeled with PE- and APC-conjugated streptavidin. Top panels show representative plots. Bottom panels show results for the percentage of Tet+ cells among each population (left), the absolute number of cells (middle), and the percentage of total organ cells (right) ± SEM. *P < 0.05; **P < 0.01. n = 4–6.
Figure 5
Figure 5. In vitro and in vivo suppressive potential of Du51-specific CD40IgCD8+ Tregs.
(A) The relative proportion of CFSE-labeled LEW.1A dividing CD4+CD25 T cells stimulated with either donor LEW.1W (direct pathway) or alloantigen-loaded recipient LEW.1A (indirect pathway) pDCs was analyzed after 6 days of culture in the absence or presence of LEW.1A naive, total, Tet, or Tet+ CD8+CD40Ig Tregs at a 1:1 effector/suppressor ratio. The proportion of dividing CD4+CD25 T cells in the control proliferation condition with pDCs only represented approximately 80% of the cells on day 6 and was given a value of 100 in each experiment. Graphs represent the mean ± SEM of the relative proportion of dividing CD4+CD25 T cells. *P < 0.05. n = 4. (B) 2.5 × 10⁶ total or Tet CD8+CD40Ig Tregs were injected i.v. into sublethally irradiated recipients (LEW.1A) the day before heart allotransplantation (LEW.1W). Graft survival was assessed by abdominal palpation of cardiac beating. **P < 0.01 for total (n = 4) versus Tet CD8+CD40Ig Tregs (n = 3).
Figure 6
Figure 6. Features and diversity of Vβ11 TCR aa repertoires.
Comparison of the features (AD) and diversity (E and F) of Vβ11 TCR aa repertoires obtained from CD8+CD45RClo Tregs from naive spleens, bulk or Du51 Tet+ CD8+CD40Ig Tregs from spleens, and GITCs from CD40Ig-treated grafts. Shown are the percentages of the TCRβ aa clonotypes (A and C) and the TCRβ repertoires (i.e., including clonal dominance) (B and D) for each naive and CD40Ig-treated animal using a particular CDR3 length (A and B) and Jβ gene (C and D). The number of TCR aa clonotypes (E) and Simpson’s diversity indices (F) were estimated for a sample size of 44 TCR sequences per individual repertoire. The diversity of the TCR repertoires in CD40Ig-treated animals was compared with that of naive animals using a Kruskal-Wallis test and Dunn’s multiple comparison post tests. *P < 0.05.
Figure 7
Figure 7. Features and diversity of Vβ18 TCR aa repertoires.
Comparison of the features (AD) and diversity (E and F) of Vβ18 TCR aa repertoires obtained from CD8+CD45RClo Tregs from naive spleens, GITCs from CD40Ig-treated grafts, and Du51 Tet+ CD8+CD40Ig Tregs from spleens. Shown are the percentages of the TCRβ aa clonotypes (A and C) and the TCRβ repertoires (i.e., including clonal dominance) (B and D) for each naive and CD40Ig-treated animal using a particular CDR3 length (A and B) and Jβ gene (C and D). The number of TCR aa clonotypes (E) and Simpson’s diversity indices (F) were estimated for a sample size of 44 TCR sequences per individual repertoire. The diversity of the TCR repertoires in CD40Ig-treated animals was compared with that of naive animals using a Kruskal-Wallis test and Dunn’s multiple comparison post tests. *P < 0.05; **P < 0.01.
Figure 8
Figure 8. Tolerance induction after in vivo peptide Du51 infusion.
(A) Recipients were either untreated (n = 9), treated with 5 i.v injections of 0.5 mg peptide (n = 4), or treated with short-term continuous peptide infusion by an i.p mini-osmotic pump delivering either 0.5 mg/day alone (n = 8) or combined with a depleting anti-CD8 mAb (OX8) (n = 6) or an anti-MHC class I mAb (OX18) (n = 5), 1 mg/day in the LEW.1W/LEW.1A (n = 5) or BN/LEW.1A (n = 4) strain combination. **P < 0.01, 0.5 mg/day Du51 versus untreated animals and 0.5 mg/day of control peptide. *P < 0.05, 0.5 mg/day Du51 plus OX8 versus 0.5 mg/day Du51. ***P < 0.001, 1 mg/day Du51 versus untreated animals. **P < 0.01, 1 mg/day Du51 versus 1 mg/day Du51 in BN/1A. *P < 0.05 1 mg/day Du51 versus 0.5 mg/day Du51. (B) Anatomopatologic analysis of graft for signs of chronic rejection lesions comparing native heart with that of Du51-treated (20.83 μg/hour) long-term surviving recipients. A, adventitia; M, media. (C) IgG, IgG1, IgG2a, or IgG2b alloantibody production was evaluated in naive (n = 3), syngeneic (n = 3), untreated (n = 3), CD40Ig-treated (n = 3), long-term (n = 2), and Du51-treated animals with graft rejection (n = 4) less than 30 days after rejection or more than 120 days after transplantation. Graph represents MFI ± SEM. *P < 0.05; **P < 0.01; ***P < 0.001; ****P < 0.0001. (D) Splenocytes were recovered after rejection or on day 120 and analyzed by flow cytometry for the absolute number of each subpopulation from naive (n = 12), long-term (n = 2), and Du51-treated recipients with graft rejection (n = 5). (E) Spleens from naive (n = 4), long-term Du51-treated (n = 2), and Du51-treated recipients with graft rejection (n = 4) were incubated with RT1.Aa/Du51 tetramers. Graphs represents the percentage of Tet+ cells among CD8+ Tregs and the absolute number of Tet+ CD8+ Tregs in spleen ± SEM.

References

    1. Bluestone JA, Auchincloss H, Nepom GT, Rotrosen D, St Clair EW, Turka LA. The Immune Tolerance Network at 10 years: tolerance research at the bedside. Nat Rev Immunol. 2010;10(11):797–803. doi: 10.1038/nri2869. - DOI - PubMed
    1. Guillonneau C, Picarda E, Anegon I. CD8+ regulatory T cells in solid organ transplantation. Curr Opin Organ Transplant. 2010;15(6):751–756. doi: 10.1097/MOT.0b013e32834016d1. - DOI - PubMed
    1. Li XL, Menoret S, Le Mauff B, Angin M, Anegon I. Promises and obstacles for the blockade of CD40-CD40L interactions in allotransplantation. Transplantation. 2008;86(1):10–15. - PubMed
    1. Guillot C, et al. Prolonged blockade of CD40-CD40 ligand interactions by gene transfer of CD40Ig results in long-term heart allograft survival and donor-specific hyporesponsiveness, but does not prevent chronic rejection. J Immunol. 2002;168(4):1600–1609. doi: 10.4049/jimmunol.168.4.1600. - DOI - PubMed
    1. Guillonneau C, et al. CD40Ig treatment results in allograft acceptance mediated by CD8CD45RC T cells, IFN-γ, and indoleamine 2,3-dioxygenase. J Clin Invest. 2007;117(4):1096–1106. doi: 10.1172/JCI28801. - DOI - PMC - PubMed

Publication types

MeSH terms