. 2014 Jun 20;289(25):17812-29.
doi: 10.1074/jbc.M113.534750. Epub 2014 Apr 30.

Conserved modular domains team up to latch-open active protein kinase Cα

Affiliations

Conserved modular domains team up to latch-open active protein kinase Cα

Carter J Swanson et al. J Biol Chem. .

Abstract

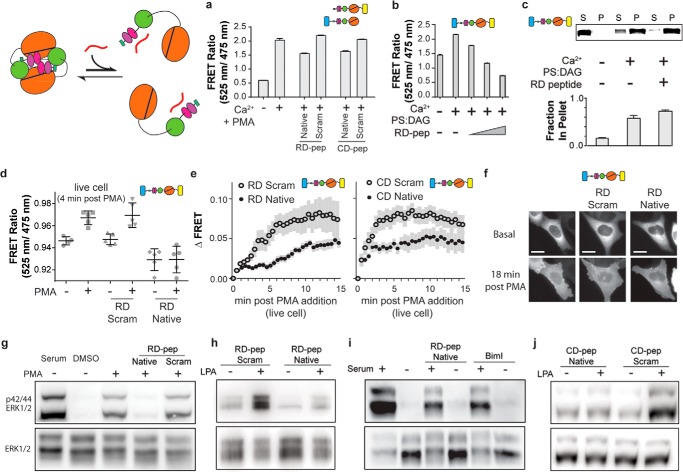
Signaling proteins comprised of modular domains have evolved along with multicellularity as a method to facilitate increasing intracellular bandwidth. The effects of intramolecular interactions between modular domains within the context of native proteins have been largely unexplored. Here we examine intra- and intermolecular interactions in the multidomain signaling protein, protein kinase Cα (PKCα). We identify three interactions between two activated PKC molecules that synergistically stabilize a nanomolar affinity homodimer. Disruption of the homodimer results in a loss of PKC-mediated ERK1/2 phosphorylation, whereas disruption of the auto-inhibited state promotes the homodimer and prolongs PKC membrane localization. These observations support a novel regulatory mechanism wherein homodimerization dictates the equilibrium between the auto-inhibited and active states of PKC by sequestering auto-inhibitory interactions. Our findings underscore the physiological importance of context-dependent modular domain interactions in cell signaling.

Keywords: Extracellular Signal-regulated Kinase (ERK); Fluorescence Resonance Energy Transfer (FRET); Homodimerization; Modular Domains; PKC; Protein Domain; Protein Kinase C (PKC); Protein-Protein Interaction.


Figures

FIGURE 1.
FIGURE 1.
Homodimerization of activated recombinant PKCα. a, schematic of PKCα and the genetic tools used in the study. Subsequent figures utilize this scheme to depict FRET reporters (written/depicted left-to-write or top-to-bottom as N- to-C-terminal). Fluorescent proteins used in this study were mCerulean (mCer) and mCitrine (mCit). b and c, FRET increases after treatment of sensors with different effector combinations. FRET spectra normalized to the FRET donor (mCer) after effector stimulation of recombinant sensor protein. Shown are emission spectra of mCer-PKCα-mCit (50 nm) (b) or mCer-PKCα (30 nm) (c) and PKCα-mCit (100 nm) excited at 430 nm in the presence of EGTA (Basal) or with 1.5 mm CaCl2 or the combination of effectors 1.5 mm CaCl2 and 3.2 μm PMA or 750 μm CaCl2 and 50 μg/ml DAG and 25 μg/ml PS. In c the emission of 30 nm mCer-PKCα (light blue) and 100 nm PKCα-mCit (yellow) was obtained separately after donor excitation at 430 nm in the presence of EGTA, and the two spectra were added and normalized to the peak donor (mCer) emission value at 475 nm to estimate the FRET-independent cross-excitation of the acceptor mCit. CFP, cyan fluorescent protein. d, bimolecular FRET sensors composed of the C2 domain (residues 185–292) or full-length PKC, fused to mCit or mCer, at matched concentrations under the specified conditions. The C2 domain shows an increase in FRET after activation with Ca2+ + PS/DAG but not Ca2+ + PMA. Both activation conditions result in an increase in FRET greater in the full-length sensors relative to the C2 domain sensors. Error bars, S.E. n ≥ 3. e and f, cross-linking of recombinant protein shows homodimer formation after effector stimulation. e, representative SDS-PAGE of disulfide cross-linked PKCα-FLAG. BMH (2-min incubation) increases the apparent molecular weight of PKCα by ∼2.5 fold in the presence of 750 μm CaCl2 and 50 μg/ml DAG and 25 μg/ml PS. f, a representative immunoblot using an anti-PKCα antibody resolves single BMH cross-linked bands of equivalent mass but differing intensities after incubation of PKCα-FLAG with indicated effectors as in c. g, increasing concentrations of PKCα result in a constant amount of cross-linked protein despite increased PKC binding to a fixed density of liposomes. Top, representative SDS-PAGE of cross-linked PKCα for a fixed concentration of liposome (∼80 μg/ml PS rich brain polar lipid extract (Porcine) mixed with 2% w/w DAG) as a function of increasing concentrations of PKCα-FLAG. All samples were treated with 25 μm BMH for 3 min. The final well includes C619A mutant PKCα-FLAG under matched conditions. Bottom, PKCα-FLAG was incubated with or without the sucrose loaded liposomes used in the cross-linking assay (top) and fractionated by ultracentrifugation; the supernatant or pellet was subsequently separated by SDS-PAGE. Saturation of the liposomes with PKCα-FLAG occurred at a concentration between 800 and 1600 nm. PKCα-FLAG (C619A) does not cross-link under the same conditions as WT but demonstrates a comparable ability to associate with liposomes.
FIGURE 2.
FIGURE 2.
Characterization of PKCα sensors. a–c, sensors were analyzed for expected protein size and priming phosphorylation levels at the turn motif (Thr-638) and hydrophobic motif (Ser-657) sites assessed by immunoblotting with phospho-specific antibodies. Representative blots of PKCα-FLAG, mCer-PKCα-mCit-FLAG, mCer-CD-mCit-FLAG (a), RD- n nm SPASM- CD (n = 10, 20, or 30) (b), and PKCα-mCit-FLAG WT, T638A and S657A (c) are shown. d, specific activities of PKCα-FLAG with equimolar concentrations (20 μm) of three different phosphorylation substrates, histone IIIs, MBP full-length, and MBP peptide (residues 4–14). In each case a substantial increase in specific activity was observed after the addition of 750 μm CaCl2 and ∼80 μg/ml PS rich brain polar lipid extract (porcine) mixed with 2% w/w DAG. The means and S.E. of n = 6–18 reactions are reported. Negligible ATPase activity was observed in the absence of any phosphorylation substrate (data not shown). e, ATPase activity for the indicated concentrations of PKCα-FLAG and mCer-PKCα-mCit-FLAG in matched reactions with histone IIIs (12.5 μm) for 5 min. Raw data of luminescence intensity (proportional to residual ATP concentration at the end of the assay) was from the Kinase-Glo assay (Promega). Four independent reactions are shown with the means and S.E., and the calculated specific activities are shown at the right. ATPase activity is comparable between both constructs, and neither was sensitive to changes in concentration from 10 to 40 nm. AU, arbitrary units. f and g, MANT-ADP can be used to detect nucleotide binding to PKCα. f, raw spectra of PKCα-FLAG (1 μm) alone (green), incubated with MANT-ADP (120 μm; blue), or MANT-ADP and ADP (400 μm; red), or MANT-ADP alone (purple) excited at 290 nm (main) or 340 nm (inset) all in the presence of 1.5 mm CaCl2 and 3.2 μm PMA. g, the difference in MANT-ADP fluorescence at 450 nm with or without PKCα-FLAG (1 μm) in the presence of CaCl2 and PMA as a function of increasing MANT-ADP concentration. Specificity of MANT-ADP binding was assessed by the addition of 2 mm ADP in the presence of 120 μm MANT-ADP (red). Data are fit to a One Site-specific Binding function (Prism) to generate the indicated KD of MANT-ADP binding to PKCα-FLAG. h, C-tail-deleted sensors retain the ability to bind nucleotide. MANT-ADP binding (increase in fluorescence at 450 nm) to PKCα-ΔC-tail-mCit (300 nm) in the presence or absence of ADP (400 μm; MANT-ADP, 30 μm). Measurements are made in the presence of 750 μm CaCl2 and ∼80 μg/ml DAG/brain extract liposomes. Error bars, S.E., n ≥ 3.
FIGURE 3.
FIGURE 3.
Affinity of the homodimer interaction and its effect on kinase activity. a, increased FRET ratio can be quenched by the addition of non-fluorescent PKCα. The FRET ratio of mCer-PKCα-mCit-FLAG (50 nm) with the indicated effectors with and without PKCα-FLAG (200 nm) is shown. b, competitive inhibition of PKCα dimerization can be used to estimate equilibrium dissociation constant (KD). Increasing concentrations of PKCα-FLAG quench FRET levels of activated mCer-PKCα-mCit (Ca2++PS/DAG). Data are represented as inverse FRET ratio (475 nm/525 nm). ↑ Inverse FRET ratio = ↓ FRET. Equilibrium equations (inset) were fit to data to calculate a KD < 5 nm. c, specific activity correlates with the extent of dimer formation. FRET levels (black; left y axis) and specific activity (blue; right y axis) of mCer-PKCα-mCit with increasing lipid concentration (R2 = 0.91). Error bars, S.E. n ≥ 3.
FIGURE 4.
FIGURE 4.
FRET increase and ERK1/2 phosphorylation are observed in CHO cells following PMA stimulation. a–c, PMA stimulation induces membrane translocation and increased FRET. a, representative image of a CHO cell stably expressing mCer-PKCα-mCit-FLAG before and 12 min after PMA stimulation (10 μm). Align is the alignment of the FRET donor (green) and FRET acceptor (red) channels. FRET is the pseudocolored pixel-by-pixel ratio of FRET acceptor to donor channel intensities using the indicated heat map. The microscope was focused on the basolateral cell membrane, where the fluorescent protein accumulates upon PMA stimulation. This method was chosen as a means to provide a larger surface area to integrate FRET ratios compared with the peripheral accumulation of fluorescence observed in a cross-sectional view of the cell (d). b, shown is the change in FRET in individual adherent cells by microscopy (open black circles) or suspended cells by spectroscopy (green squares) as a function of time post addition of PMA or DMSO control (closed black circles). For microscopy, results are the mean ± S.E. from 6–8 independent experiments (n > 51 cells). For spectroscopy, results are the mean ± S.E. of n ≥ 3 independent experiments. c, representative time course of PMA stimulation images of CHO cells stably expressing mCer-PKCα-mCit-FLAG (mCit fluorescence). Scale bar, 10 μm. d, PKC translocates primarily to the plasma membrane with residual localization in the cytosol, nucleus, and cellular punctae. Shown are deconvolved images of the 16-min time point (c) at three different z-sections (2.5 μm apart). e and f, PMA stimulates PKC specific phosphorylation of ERK1/2. e, representative blot of the phosphorylation status of ERK1/2 in the same cell line (a) after the addition of PMA (1.92 μm) at the indicated time points. f, representative blot of ERK1/2 phosphorylation before or 15 min after PMA stimulation in the presence or absence of the PKC specific inhibitor BimI (1.5 μm).
FIGURE 5.
FIGURE 5.
FRET increase and ERK1/2 phosphorylation are observed in CHO cells following LPA stimulation. a and b, concurrent transient membrane translocation and FRET increase after LPA (50 μm) stimulation. a, top, representative images of CHO cells with stable expression of mCer-PKCα-mCit. Translocation of the sensor from a diffuse cytosolic distribution (pre) to an accumulation on the basolateral membrane (25 s post LPA), which dissipates over time (69 s), depicts the canonical PKC response to activation. As would be expected based on previous observations (40), ∼50% of the cells show the characteristic membrane translocation response after LPA stimulation. Bottom, FRET measurements are depicted as a heat map in corresponding images. Scale bar = 10 μm. Data are representative of n > 25 cells. b, FRET ratio for cells in a. FRET ratios are normalized to the value at t = 1 s and adjusted for photo bleaching. c, biphasic ERK1/2 response to LPA stimulation. Shown is a representative blot and quantification of n ≥ 5 independent replicates of ERK1/2 phosphorylation after LPA treatment (10 μm). d, representative blot of ERK1/2 phosphorylation before or 15 min after LPA stimulation in the presence or absence of the PKC-specific inhibitor BimI (1.5 μm).
FIGURE 6.
FIGURE 6.
Conformation of the PKC homodimer. a–d, change in FRET ratio (ΔFRET) from basal (EGTA (EG)) to activating (Ca2+ + PMA (CP)) conditions for the indicated sensors. a–d, FRET donor and acceptor are on different sensors. An increase in FRET indicates an intermolecular interaction. e and f, FRET donor and acceptor are on the same sensor but separated by an ER/K linker. In the absence of an interaction, the 10-nm ER/K linker separates domains beyond FRET distance. An increase in FRET indicates enhanced interaction between domains at either end of the ER/K linker. a, C1 and C-tail domains are essential for PKCα homodimerization; mCer-PKCα + PKCα-mCit with no truncation (WT) or ΔC1, ΔC2, ΔC-tail in both proteins. b, a bimolecular RD-RD interaction, but not an RD-CD interaction or CD-CD interaction is detected after activation. RD-CD, mCer-CD + mCit-RD; RD-RD, mCit-RD + mCer-RD; CD-CD, mCer-CD + mCit-CD (50 nm donor sensor, 100 nm acceptor sensor). c, the C-tail in the catalytic domain is essential for homodimerization. 1, mCer-PKCα + mCit-PKCα; 2, mCer-PKCα + PKCα-ΔC-tail-mCit; 3, mCer-PKCα-ΔC-tail + mCit-PKCα. d, both the RD and CD domains reside at the dimerization interface. 1, RD-mCer-30-nm ERK-CD + RD-30 nm ERK-mCit-CD; 2, RD-30-nm ERK-mCer-CD + RD-30-nm ERK-mCit-CD. e, enhanced RD-CD interaction in the PKC homodimer. 1, PS-mCer-10-nm ERK-mCit-C1-C2-CD; 2, PS-C1-mCer-10-nm ERK-mCit-C2-CD; 3, RD-mCer-10-nm ERK-mCit-CD. f, C1a, C1b, and C2 domains partially contribute to dimerization, whereas the C-terminal 15 residues of the C-tail are essential. Shown is change in FRET upon activation of type 3 configuration (as in e), with truncation of the C1a, C1b, C2 domains or the C-terminal 15 residues of the C-tail. g, proximity of the C-tail to the homodimer interface. Shown is a representative Coomassie-stained gel of PKCα-FLAG protein under basal or activated (Ca2++DAG/PS) conditions. Data for full-length PKCα (WT), domain deletions (ΔC1a, ΔC1b), and mutant (C619A) proteins are shown. Note the complete loss of detectable dimerization upon mutagenesis of a Cys-619 in the C-tail region of the CD. The BMH cross-linker has a maximal reach of 1.4 nm. For reference the C1b domain is about 3 × 2 × 2 nm (18). h, model for dimer formation based on data presented in a–g. I, RDs interact with each other upon effector stimulation to nucleate homodimerization. II, RD-CD interaction in trans facilitated by the C-tail. III, proposed conformation for the PKC homodimer. a–f, error bars, S.E. n ≥ 3.
FIGURE 7.
FIGURE 7.
Dimerization facilitates high kinase activity through disruption of auto-inhibition. a, effector binding and not disruption of the RD-CD interaction is necessary for homodimer formation. Perturbation of the basal RD-CD interaction with an ER/K linker does not induce dimerization. The basal (solid) and activated (hollow) FRET ratio of three PKC reporters with 10-, 20-, and 30-nm SPASM modules inserted between the RD and CD (between Glu-292 and Gly-293). All three sensors have increased FRET after the addition of Ca2+ + PMA. b, disruption of the basal RD-CD interaction only modestly increases specific activity. The activity of the 10- and 30-nm sensors (80 nm) under the indicated conditions with histone IIIs (gray) or MBP peptide (red) as substrate is shown. TEV treatment cleaves a specific site engineered at the N terminus of the ER/K linker separating the RD from the CD. TEV treatment followed by the addition of Ca2+ and DAG/PS yields maximal activity of the catalytic domain due to membrane partitioning of the RD and soluble partitioning of the CD. The basal activity but not the activity in the presence of effectors was significantly enhanced when increasing the SPASM module length from 10 to 30 nm (Student's t test 99% confidence interval: p values for not significant (ns) = 0.073; * = 0.0212; ** = 0.0042, **** < 0.0001). a and b, error bars, S.E. n ≥ 3. c, schematic of the effect of the different length ER/K linkers on the three-state equilibrium for PKCα.
FIGURE 8.
FIGURE 8.
Point mutation in the turn motif phosphorylation site causes PKCα to dimerize basally in vitro. a, schematic of the interface between C1b (magenta surface contour) and the catalytic domain of PKCβII (PDB code 3PFQ) highlighting the c-tail (cyan schematic), the BMH cross-linked C619 (yellow spheres), and residues mutagenized (orange spheres). b and c, only T638A (turn motif) shows a substantial change in FRET compared with WT in both basal and effector-stimulated conditions when inserted into both mCer-PKCα-FLAG + PKCα-mCit-FLAG sensors. d, BMH cross-linking supports enhanced basal dimerization of T638A mutant. Wild type or T638A PKCα-mCit-FLAG cross-linking was assessed under the indicated conditions. The inset shows the contrast-adjusted intensity from the same gels. e, loss of turn-motif phosphorylation does not induce dimerization solely through allosteric changes in hydrophobic motif site. Basal FRET levels for WT, turn motif mutant (T638A), hydrophobic motif mutant (S657A), and double mutant (T638A/S657A) bimolecular FRET sensors (mCer-PKCα-FLAG + PKCα-mCit-FLAG) are shown. f, PyMOL-aligned crystal structures (PDB code 2I0E, blue and black ribbon; PDB code 3PFQ, cyan and gray) of the PKCβII catalytic domain highlighting the relative positions of the c-tail (615 - 669). The phosphorylated turn motif residue (T638; red spheres) interacts tightly with the catalytic domain through four conserved electrostatic interactions (in PKCβII K350, K355, K374, R415) that appear to serve as a fulcrum point around which conformational changes in the c-tail are centered.
FIGURE 9.
FIGURE 9.
Disruption of activation induced PKC sensor high FRET state in CHO cells modulates PKC function. a, peptides from the RD and CD domains can disrupt dimerization in recombinant protein. Shown is the FRET ratio for mCer-PKCα (40 nm) combined with PKCα-mCit (160 nm) under the indicated conditions. Ca2++PMA, 1.5 mm CaCl2 + 3.2 μm PMA. RD-pep and CD-pep are myristoylated peptides analogous to residues 218–226 in the regulatory domain and 633–642 in the catalytic domain. Native, native PKC sequence; Scram, matched scrambled sequence control. Peptides concentrations were 10 μm. b, peptides decrease FRET in a concentration-dependent manner. The in vitro FRET ratios of mCer-PKCα-mCit-FLAG with increasing concentrations of RD-pep (0, 10, 20, 50 μm) are shown. c, peptide does not alter membrane translocation of PKC. mCer-PKCα-mCit-FLAG was incubated with Ca2+ and sucrose-loaded PS/DAG vesicles with and without the native RD-pep, before ultra-centrifugation. After ultracentrifugation, the pelleted (P) and supernatant (S) fractions were run on an SDS-PAGE gel and scanned for mCit fluorescence. Top, a representative gel image; Bottom, quantification from three separate experiments. d and e, peptides suppress the characteristic increase in mCer-PKCα-mCit FRET after PMA stimulation in live cells. d, FRET ratio of suspended CHO cells (fluorometer detection) stably expressing mCer-PKCα-mCit-FLAG, pre- and 4 min post-10 μm PMA addition in the presence or absence of 20 μm concentrations of the indicated peptide. Maximum FRET was observed 4 min post-PMA stimulation (see Fig. 2a). Error bars, S.E. n > 5. e, microscope-based detection of changes in FRET ratio (Δ FRET) in adherent cells, preincubated for 15 min with the indicated peptides (10 μm) followed by stimulation with 10 μm PMA. Error bars, S.E. n = 13–24 cells. f, peptides do not influence membrane translocation of PKCα. Representative images of cells pre- and 18 min post-PMA addition. Scale bars = 10 μm. g–j, RD and CD peptides, but not matched scrambled controls, disrupt PMA or LPA-stimulated ERK1/2 phosphorylation. Peptides do not influence PKC-independent (serum)-driven phosphorylation of ERK1/2. Serum-starved CHO cells stably expressing mCer-PKCα-mCit-FLAG were preincubated with 20 μm concentrations of the indicated peptide (or 1.5 μm BimI) for 15 min before stimulation (10% serum, 10 μm LPA, or 1.92 μm PMA) and lysed 15 min post-stimulation. Representative Western blots of phospho and total ERK1/2.
FIGURE 10.
FIGURE 10.
Disruption of the auto-inhibited state prolongs translocation. a, BimI (10 μm) destabilizes the auto-inhibited state. FRET ratio in the absence of effectors of sensor with a SPASM module inserted between RD and CD (between Glu-292 and Gly-293). b and c, BimI increases dimer formation after effector stimulation. b, FRET ratio for mCer-PKCα with PKCα-mCit. c, cross-linking analysis of PKCα-FLAG incubated with Ca2+ and PMA or Ca2+ and PS:DAG. d and e, BimI induces sustained translocation of PKCα. d, top, representative images of CHO cells stably expressing mCer-PKCα-mCit pre- and 30- and 120 s post-LPA (50 μm) stimulation. Two cells with transient translocation are highlighted (white arrows). Translocation was observed as either a ring of high intensity fluorescence or the appearance of fluorescence along the basolateral membrane of the cell. Bottom, representative images with the addition of 1.5 μm BimI 2 min before LPA stimulation. The white arrow highlights a cell with a sustained translocation response. Scale bars = 10 μm. e, translocation response in CHO cells stably expressing the mCer-PKCα-mCit sensor in response to LPA stimulation (50 μm) without or with 1.5 μm BimI pretreatment. Cells were binned as no apparent response (None), a transient translocation response (Transient, translocation occurs and recedes within 120 s), or a sustained translocation response (Sustained, translocation is still present after 120 s). Data points represent five independent experiments, ∼20 cells per experiment. The fraction of the cells binned in each category for each experiment is plotted with a spread in the data indicated as the mean ± S.E. f, schematic illustrating the effect of BimI on the three-state equilibrium of PKCα.
FIGURE 11.
FIGURE 11.
Dimerization latches open the stimulated kinase. Dimer formation allows for more specific activity from lower levels of effectors. a, PKC activation is modeled as a three-state (closed, Open, or Dimer) equilibrium with equilibrium constants Kopen and Kdimer. b, the specific activity of PKC when the closed state is inactive and both the open and dimer state are fully active is plotted as a function of opening PKC (↑ Kopen). For a given potency of effectors in releasing PKC auto-inhibition (defined Kopen), dimer formation can substantially enhance specific activity. Factors that control dimer formation (Kdimer), including local concentration of protein, co-factors, and small molecules, can tune local PKC activity over a wide range. The black line represents PKC with no ability to form a dimer, whereas the blue lines have increasingly higher values of Kdimer.

References

    1. Copley R. R., Schultz J., Ponting C. P., Bork P. (1999) Protein families in multicellular organisms. Curr. Opin. Struct. Biol. 9, 408–415 - PubMed
    1. Lander E. S., et al. (2001) Initial sequencing and analysis of the human genome. Nature 409, 860–921 - PubMed
    1. Pawson T., Nash P. (2003) Assembly of cell regulatory systems through protein interaction domains. Science 300, 445–452 - PubMed
    1. Bhattacharyya R. P., Reményi A., Yeh B. J., Lim W. A. (2006) Domains, motifs, and scaffolds: the role of modular interactions in the evolution and wiring of cell signaling circuits. Annu. Rev. Biochem. 75, 655–680 - PubMed
    1. Letunic I., Doerks T., Bork P. (2012) SMART 7: recent updates to the protein domain annotation resource. Nucleic Acids Res. 40, D302–D305 - PMC - PubMed

Publication types

MeSH terms

Substances

LinkOut - more resources