

Historical gains in soybean (Glycine max Merr.) seed yield are driven by linear increases in light interception, energy conversion, and partitioning efficiencies
- PMID: 24790116
- PMCID: PMC4071847
- DOI: 10.1093/jxb/eru187
Historical gains in soybean (Glycine max Merr.) seed yield are driven by linear increases in light interception, energy conversion, and partitioning efficiencies
Abstract
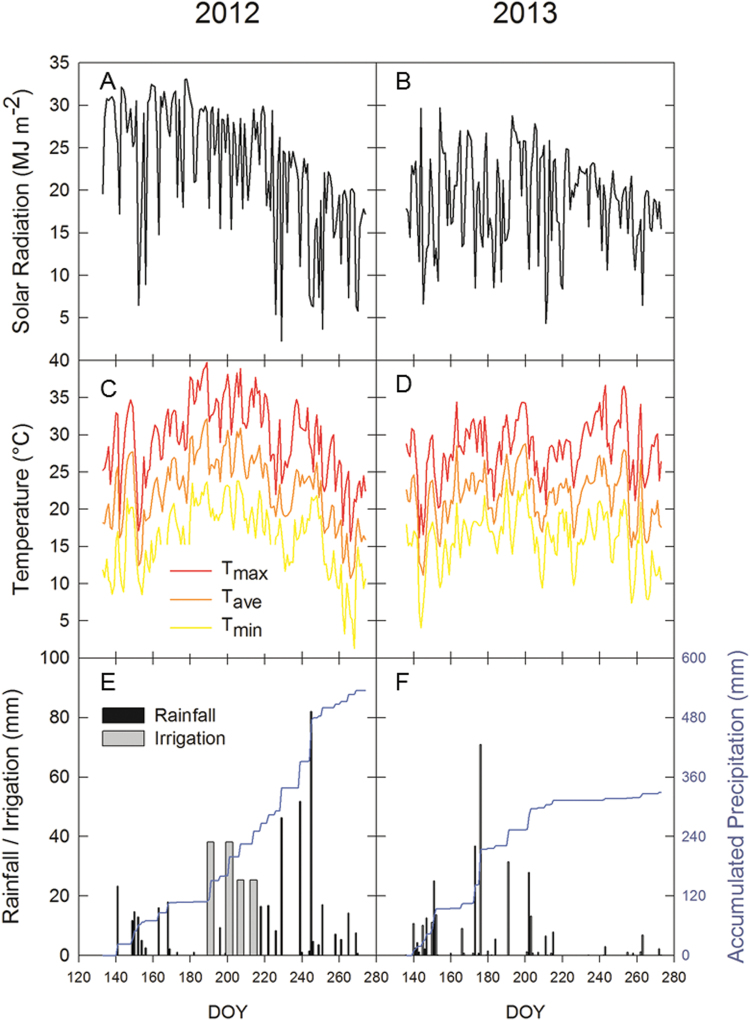
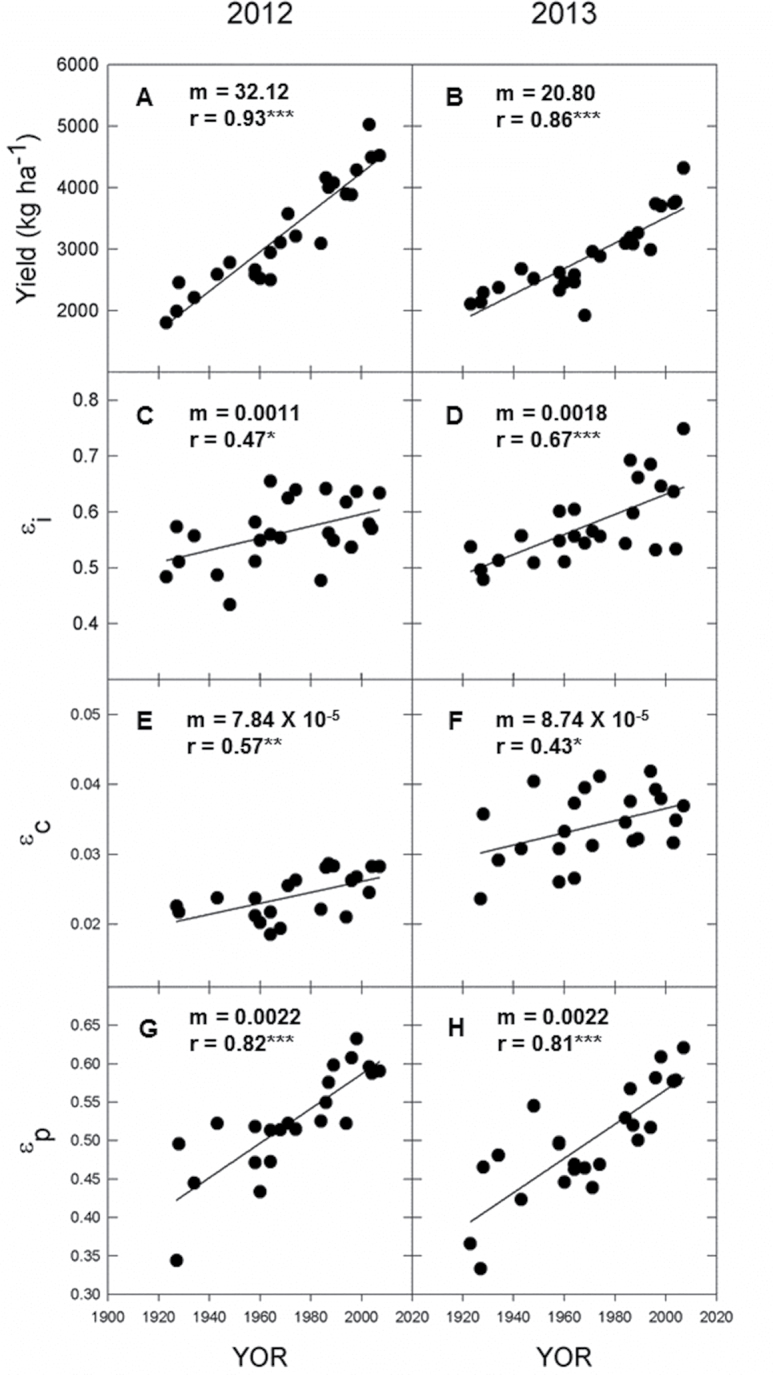
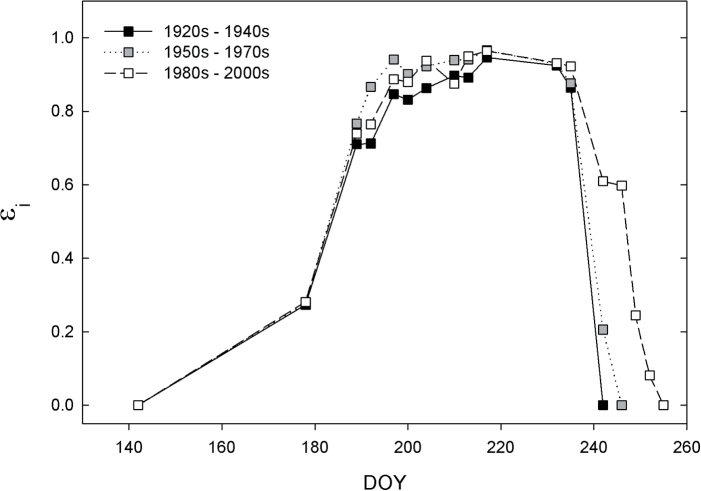
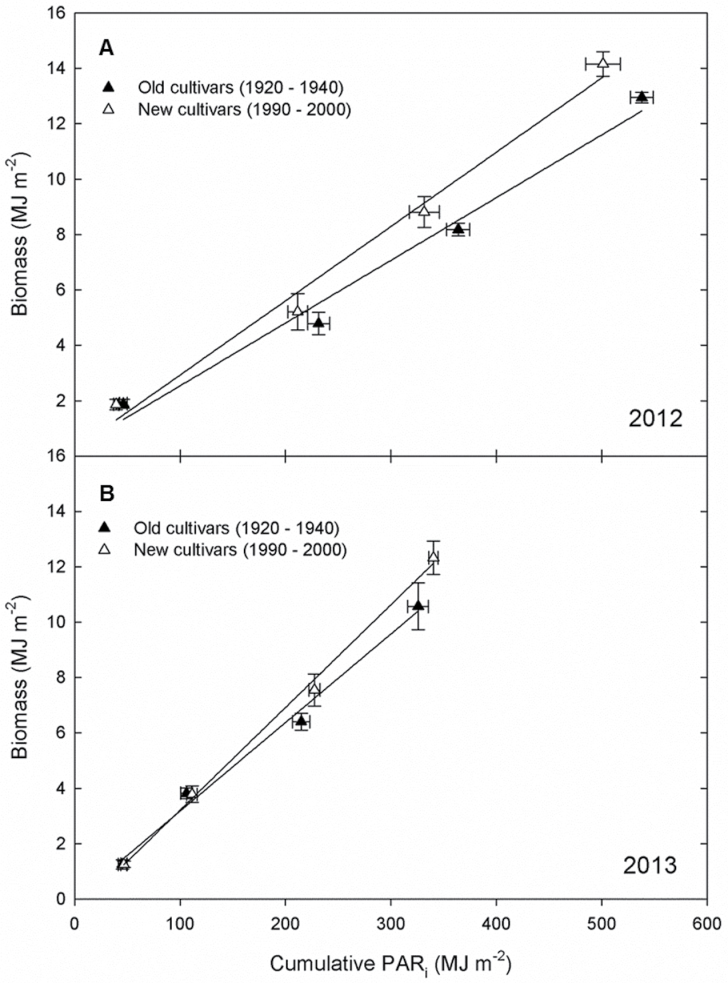
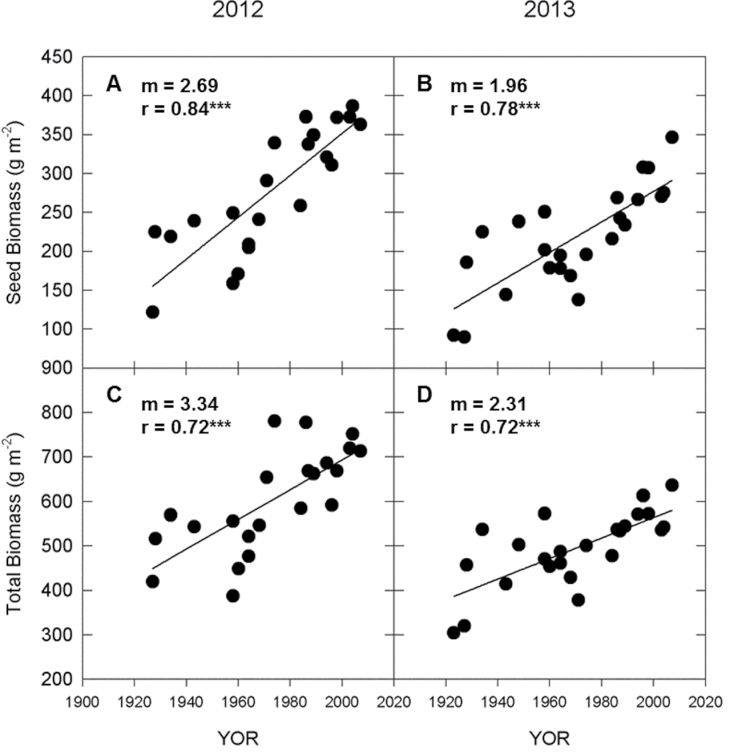
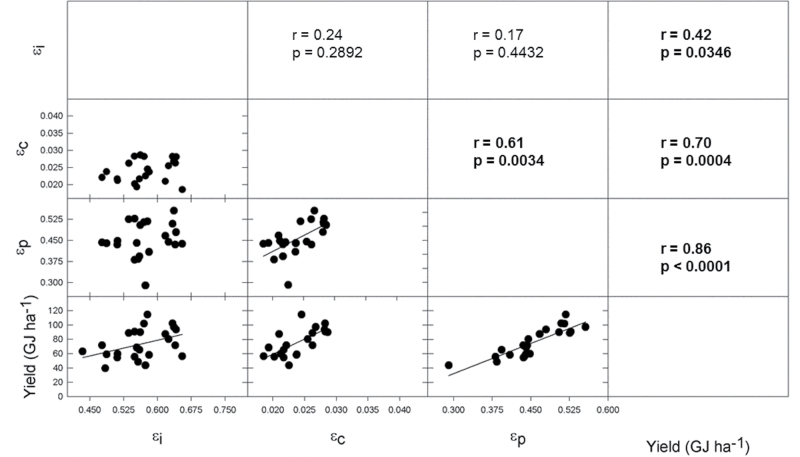
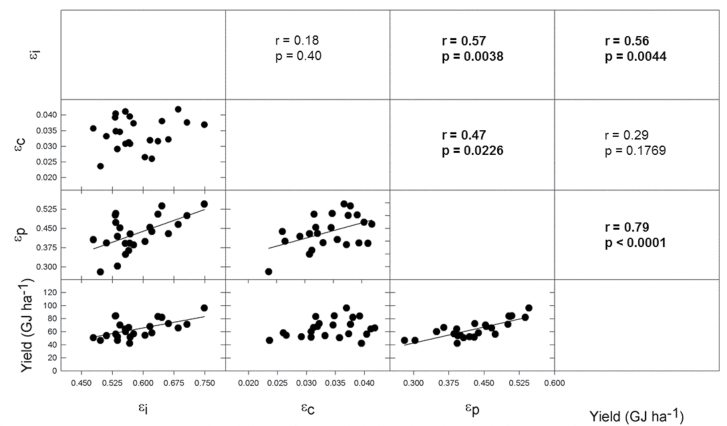
Soybean (Glycine max Merr.) is the world's most widely grown leguminous crop and an important source of protein and oil for food and feed. Soybean yields have increased substantially throughout the past century, with yield gains widely attributed to genetic advances and improved cultivars as well as advances in farming technology and practice. Yet, the physiological mechanisms underlying the historical improvements in soybean yield have not been studied rigorously. In this 2-year experiment, 24 soybean cultivars released between 1923 and 2007 were grown in field trials. Physiological improvements in the efficiencies by which soybean canopies intercepted light (εi), converted light energy into biomass (εc), and partitioned biomass into seed (εp) were examined. Seed yield increased by 26.5kg ha(-1) year(-1), and the increase in seed yield was driven by improvements in all three efficiencies. Although the time to canopy closure did not change in historical soybean cultivars, extended growing seasons and decreased lodging in more modern lines drove improvements in εi. Greater biomass production per unit of absorbed light resulted in improvements in εc. Over 84 years of breeding, soybean seed biomass increased at a rate greater than total aboveground biomass, resulting in an increase in εp. A better understanding of the physiological basis for yield gains will help to identify targets for soybean improvement in the future.
Keywords: Energy conversion efficiency; harvest index; light interception efficiency; partitioning efficiency; radiation use efficiency; yield potential..
© The Author 2014. Published by Oxford University Press on behalf of the Society for Experimental Biology.
Figures
References
-
- Ainsworth EA, Yendrek CR, Skoneczka JA, Long SP. 2012. Accelerating yield potential in soybean: potential targets for biotechnological improvement. Plant, Cell and Environment 35, 38–52 - PubMed
-
- Akita A. 1988. Physiological basis of heterosis in rice. In: Hybrid rice. Proceedings of the International Symposium on Hybrid Rice. Los Banos, Phillipines: International Rice Research Institute; pp 67–77
-
- Austin RB, Ford MA, Morgan CL. 1989. Genetic improvement in the yield of winter wheat: a further evalutation. Journal of Agricultural Science 112, 295–301
-
- Amthor JS. 2010. From sunlight to phytomass: on the potential efficiency of converting solar radiation to phyto-energy. New Phytologist 188, 939–959 - PubMed
-
- Angel J. 2009. The Water and Atmospheric Resources Monitoring Program. Urbana, IL: Illinois State Water Survey, University of Illinois at Champaign-Urbana
MeSH terms
LinkOut - more resources
Full Text Sources
Other Literature Sources
Research Materials
Miscellaneous
